
I posted two channels on Friday, one rising and one falling, and at the intersection they formed a diamond. That diamond broke up late on Friday and ES moved to a new high overnight. It may have peaked, but looking at the chart the obvious next target is 1200:
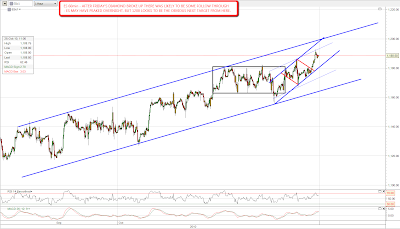
USD moved down as well, but as yet there's nothing yet to suggest that the recent low in USD was not a major low. If EURUSD makes a new high though then the next target up is 1.43, and USD will then make a new low. Any move on EURUSD over 1.41 will make that look very possible:

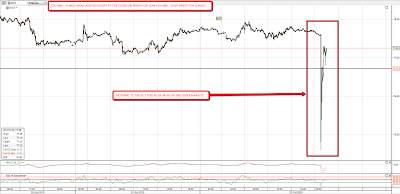
There was some odd stuff appearing near the close on Friday and over the weekend. For a while on Saturday /TF (Russell 2000 futures) appeared to be trading on TOS and OptionsXpress and 5% down. Even stranger was the apparent move in /DX (USD futures) on Friday night, where there was a massive spike down that was recovered within 30 minutes. In terms of scale this move would have been approximately equivalent to a move on EURUSD from 1.395 to 1.46 and back again. I'm assuming that this was a ghost in the machine and that any trades from this 'USD flash crash' will be cancelled this morning. Here it is on the DX 5min chart:
Looking at other charts I saw on Friday that the big falling wedge on XLF had evolved into a big declining channel. Financials have shown few signs of life on this big move up on equities, and there's no sign yet that they're going to start recovering anytime soon:

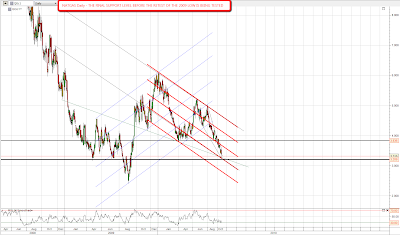
There's been a lot of talk that natural gas might bounce soon, but there's not much sign of that on the daily chart. It could bounce, we're not at the last major support level above the 2009 low. If it breaks then a retest of the 2009 low looks very likely:
Friday was an unusual day for two reasons. Firstly the range was the smallest of the preceding seven days, so the GapGuy says that any opening gap is less likely to be closed. The second reason was that Friday was an all up day, in which SPX,USD, Oil, Gold and AGG (bonds ETF) were all up. Historically these are usually followed by negative closes but I'd be cautious about putting any money on that today unless we first see a hit of the obvious ES resistance level at 1200.
Some people have been having trouble viewing much chart, so I'm trying something different this morning and linking the smaller charts to screencast. Clicking on a chart yields a much bigger chart.
