
I had an idea of what I'd expect to see at the end of last week, and it was to see EURUSD & GBPUSD make nice lows at support, and then a few days of recovery this week during which ES & NQ would probably make new highs to finish off wave 5 of the equities wave up from the August lows. That would create an ideal shorting opportunity with equities and USD moving in sync with equities falling and USD rising, rather than the out of sync chop we have seen over the last couple of weeks.
Unfortunately that just didn't happen. EURUSD made a very mushy and unreliable low at support, rather than the nice clean bounce I was hoping for, and GBPUSD fell through short term support altogether. I wasn't surprised to see both make new lows overnight and to see that they failed to break declining resistance this morning. That's not great for the bear side here as it looks clear watching equities and USD in recent weeks that the wave up in equities doesn't seem to have finished, and until it does, a rising USD won't do much more that stall equities near this level or a bit lower.
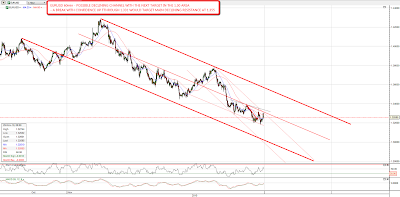
I've looked closely again at the EURUSD and GBPUSD charts and I have a candidate declining channel on EURUSD. If it's right, then we'll see EURUSD make the next low soon in the 1.30 area. Within that declining channel EURUSD is declining more steeply within a smaller declining channel, and I'm looking for a break with confidence of the upper trendline of that smaller rising channel to signal that the next EURUSD low has been made:
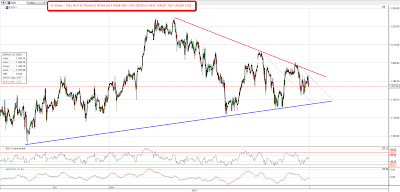
On GBPUSD I have another candidate declining channel with the next downside target in the 1.545 area. There is a falling wedge within that declining channel and I'm watching for a break of the upper wedge trendline to signal that the next GBPUSD low has been made:

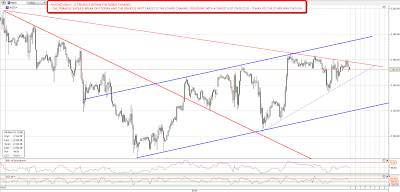
There's a nice looking falling wedge on AUDUSD, and that low was made fairly cleanly on Friday, but there's a distinct possibility that AUDUSD could break down into a declining channel and I've marked the alternate lower trendline on the chart:

So what's this saying for equities? Well in my view the outlook for post-Thanksgiving week looks weak until USD makes the next interim high. ES is in a triangle on the hourly chart and the most likely scenario looks like a test of rising support in the 1180 area. If that breaks with confidence then I'd expect a test of the recent lows:
On NQ I'm seeing a triangle within a rising channel. I'm expecting to see the triangle break down towards channel support slightly over 2120:
I'll break my usual limit rule and post a sixth chart today, and that's the simply beautiful chart for silver, with a really nice broadening ascending wedge from the 18 area. It looks weak at the moment, with a double top and negative divergence on daily RSI, but as long as it lasts, the wedge gives excellent entry and exit levels, and if it breaks down, silver will look like an excellent short term short:

