Slope of Hope Blog Posts

Slope initially began as a blog, so this is where most of the website’s content resides. Here we have tens of thousands of posts dating back over a decade. These are listed in reverse chronological order. Click on any category icon below to see posts tagged with that particular subject, or click on a word in the category cloud on the right side of the screen for more specific choices.

Where Do We Go From Here? (by David Kern)

By -

As I fought off the crippling effects of tryptophan poisoning this weekend, some brief moments of lucidity gave me opportunity to look at some charts.  What I saw inspired me to get out the crayons and make some annotations.  Whether or not all this rumination will help my stock portfolio remains to be seen.

As the ancient Chinese proverb goes, “may you live in interesting times.”  Indeed we do.  There are currently some significant contradictory signals within the world of technical analysis, and some pretty attention-getting headlines as well.  There are plenty of ominous headlines:  “S.Korea’s Lee: North to ‘pay price’ for attack“, “Saudi king urged US to attack Iran: leaked documents“; but then there is also encouraging news: “EU agrees on $89 billion bailout loan for Ireland“, and “Black Friday: More shoppers, modest sales“.

I think the only reasonable response by traders is to look at the charts, for all the news/sentiment/seasonality/astrology/etc is contained in the movement of the price.  In the end, it doesn’t truly matter why the price moved — all that matters is what movement occurred and what is likely from here.  I spent some time cuddled up to the S&P 500 chart, and my notes are summarized in the picture embedded in this post.  I thought it was especially interesting to take a step back from the daily chart to see the forest for all the trees in the weekly.  Three observations I thought worthy of mention:

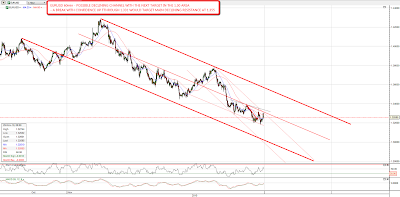
  1. Until the wheels came off the bus in Aug/Sep/Oct 2008, a support level was established in the 1200 – 1225 range.  Then the bottom dropped out.
  2. The markets digested a lot of bad news between Sept 2008 and Sept 2009 (and the bears had a massive party).
  3. Support has been established over the last year at around 1010 to 1045, with resistance near 1220 as we bump up into the previous 2008 support levels (which is where we happen to be now).

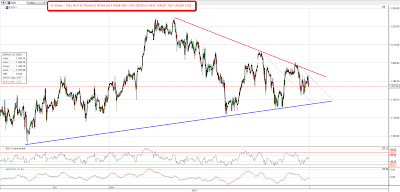
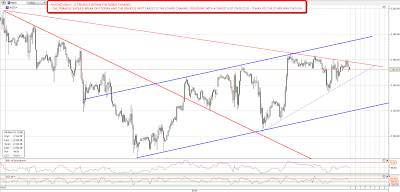
So — what now?  Based on the current readings of market breadth and bullish percents, with a clear uptrend in place: I think it’s very risky to short the market here. The “Minority Report” in favor of a bearish stance right now is the McClellan Oscillator (posted to the right), which did move to a sell signal recently.  Note that market breadth and bullish percents could swing quickly to show supply back in control, and that would change this non-bearish opinion rapidly. Even then, I would hesitate to short the market aggressively until the support at 1010 had fallen.

The least risk, of course, is to sit in cash/bonds and wait for a clear opportunity to strike.  (But that carries lots of opportunity risk…) I think with the market sitting on its 200 day moving average, plus market breadth and bullish percents showing buyers in control, there’s a lot of reason to suspect a healthy bounce higher this week.

Of course, it’s equally likely that Wall Street suffered the same tryptophan hangover I had.  Then it might be 2011 before we see any real movement bullish or bearish!

Check out the rest of David Kern's trading blog, AbjectAvarice.com

Mushy Lows (by Springheel Jack)

By -

I had an idea of what I'd expect to see at the end of last week, and it was to see EURUSD & GBPUSD make nice lows at support, and then a few days of recovery this week during which ES & NQ would probably make new highs to finish off wave 5 of the equities wave up from the August lows. That would create an ideal shorting opportunity with equities and USD moving in sync with equities falling and USD rising, rather than the out of sync chop we have seen over the last couple of weeks.

Unfortunately that just didn't happen. EURUSD made a very mushy and unreliable low at support, rather than the nice clean bounce I was hoping for, and GBPUSD fell through short term support altogether. I wasn't surprised to see both make new lows overnight and to see that they failed to break declining resistance this morning. That's not great for the bear side here as it looks clear watching equities and USD in recent weeks that the wave up in equities doesn't seem to have finished, and until it does, a rising USD won't do much more that stall equities near this level or a bit lower.

I've looked closely again at the EURUSD and GBPUSD charts and I have a candidate declining channel on EURUSD. If it's right, then we'll see EURUSD make the next low soon in the 1.30 area. Within that declining channel EURUSD is declining more steeply within a smaller declining channel, and I'm looking for a break with confidence of the upper trendline of that smaller rising channel to signal that the next EURUSD low has been made:

On GBPUSD I have another candidate declining channel with the next downside target in the 1.545 area. There is a falling wedge within that declining channel and I'm watching for a break of the upper wedge trendline to signal that the next GBPUSD low has been made:

There's a nice looking falling wedge on AUDUSD, and that low was made fairly cleanly on Friday, but there's a distinct possibility that AUDUSD could break down into a declining channel and I've marked the alternate lower trendline on the chart:

So what's this saying for equities? Well in my view the outlook for post-Thanksgiving week looks weak until USD makes the next interim high. ES is in a triangle on the hourly chart and the most likely scenario looks like a test of rising support in the 1180 area. If that breaks with confidence then I'd expect a test of the recent lows:

On NQ I'm seeing a triangle within a rising channel. I'm expecting to see the triangle break down towards channel support slightly over 2120:

I'll break my usual limit rule and post a sixth chart today, and that's the simply beautiful chart for silver, with a really nice broadening ascending wedge from the 18 area. It looks weak at the moment, with a double top and negative divergence on daily RSI, but as long as it lasts, the wedge gives excellent entry and exit levels, and if it breaks down, silver will look like an excellent short term short:

Christmas Special Rerun

By -

Well, since I spent part of this morning crying through Frosty the Snowman with my little girl – a yearly tradition for me – I'd like to offer this repost from last year on an important topic: the Rankin/Bass Christmas Specials……..

As a Gen-X child, I offer you The Truth:

  • + The original R-B special, Rudolph the Red-Nosed Reindeer, is the best. And I think it's time, as a nation, we recognize the fact that a large part of this country's current sex drive had its beginnings with Clarice the Reindeer. (I'm cuuuuuuuuute! – – followed by a none-too-subtle thrust into the open air, which is apparently quite surprising for such a young buck. Not a stitch of clothing on either, by the way.)
  • Yukon Cornelius rules.
  • Hermey has always had a special place in my heart. I guess the whole misfit thing does it – – if he were real, he'd probably hang out on Slope.
  • + You just know that the blonde-topped Fireball is going to wind up dating other bucks once he comes of age. It's obvious. My gaydar is effective even on trans-species analysis.
  • + As a father, Donner sucks. He castigates his newborn son for a minor genetic deformity….and morbidly-obese Santa doesn't help a bit either after he catches the family trying their best to mask the red nose ("Donner! You should be ashamed of yourself!") What a couple of dickweeds.
  • +The Little Drummer Boy should be banned as a song. End of story.
  • + To this day, Frosty still brings tears to my eyes. Which part? Well, obviously, the part where Karen is crying. What, you don't cry then? You probably don't like puppies, either.
  • + As R-B started rolling in dough and the 70s emerged, the quality of the specials started dropping precipitously. Witness Santa Claus is Comin' to Town. Yes, the Fred Astaire character at least provided inspiration for Mr. Hanky's special many years later, but having Santa represented by some red-headed punk still gets on my nerves.
  • + One exception to the curse of the 70s is The Year Without a Santa Claus, and that's only because of Heat Miser and Cold Miser. Which one do I prefer? Oh, come on, do you really have to ask?
  • + The other specials – – dreck such as Nestor – – don't merit any analysis. This is really all ye need know.

1208-clarice

Weekly Sector Report | 11/26/10 (by Leisa)

By -

An interrupted trading week:  interrupted by our American Thanksgiving tradition, some spit spat between N/S Korea as well as continued concerns about sovereign debt.  The broad market index was down .61% with quite a bit of push and tug in the underlying sectors.  Here's the sector summary (click all images to make larger):

  Banks, Financial Services and Financials were hardest hit.  With the USD strengthening in the wake of these concerns, Basic Materials and Resources also suffered.  Retail stood tall, and the results of Black Friday will certainly impact this sector. Let's take a look at the weekly chart of the total stock market index:

It was a light volume week due to the holiday, and the market continues to consolidate at this level. It is going to go one way or the other.  Would that I had a crystal ball!  Mine's in shards; perhaps yours is in better shape.

I want to point out the the lower part of the chart  where I've consolidated two indicators (that show up on the detail charts).  The purple dashed line shows the performance of this index for the time period shown (Jan 07- current).  The broad market is still 20% below those highs.  It is a cogent reminder that "not-losing" is the key to winning.

The market is gathering energy through this consolidation for a move.  I don't mind being marginally committed (a/k/a standing aside) to see which way that might be. If the N/S Korean conflict and the sovereign debt issues get cleared, the move is likely to be up.  If not, a pullback will be in store. I've prepared a chart book for you which you can access here.  It is a large file, so please be patient with the download.