
I've been posting about the likely USD bounce for a couple of weeks, and yesterday we hit the target for the retracement, if indeed it is just a retracement, when $USD hit the upper trendline of the declining channel:

Any higher than this in my view and we're looking at a major bullish breakout on USD, with my next pattern target over 85. It's a bit hard to see that happening with the Fed seemingly so committed to devaluation but that's my line in the sand, and in any case we should expect USD to pull back a bit from this key resistance level in the short term.
I've been looking for a lower target on EURUSD so I looked again at the chart after USD hit target yesterday and saw that EURUSD has hit the right reversal level for a rising channel on EURUSD, rather than the possible broadening wedge I had been looking at. If that rising channel holds then the next upside target is in the 1.45 to 1.50 area, so this is an interesting level for a spec long with a stop below the lower channel trendline:

What USD does here has big implications for equities. If USD reverses from resistance and resumes its swan dive downwards, then in all probability we are seeing the end of the current SPX retracement, and the start of a fresh wave up on equities. If USD breaks resistance and heads higher, then we should see a lot more downside on equities and commodities, and the big move up from July, which has piggybacked heavily on the declining dollar, is most likely over. I'm expecting a USD reversal back down here, but I'm keeping an open mind in case it goes the other way.
A lot of charts hit key retracement targets yesterday. One that I've posted here a couple of times recently is XLF, where the broken declining channel upper trendline was retested yesterday. There are many other charts that look like this, and if USD does reverse here, that's why yesterday looks like a significant swing low:

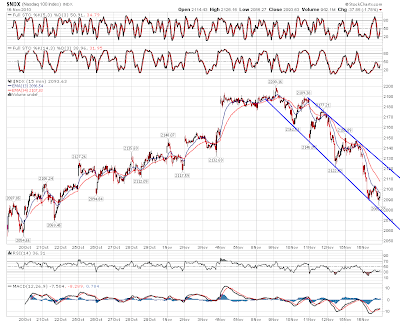
In the short term on equities, the declining channels that I posted on SPX and Nasdaq yesterday have turned out to be broadening descending wedges. There's a similar wedge on Dow as well. Here's the wedge on the Nasdaq 15min chart:
Here's the wedge on the SPX 15min chart:
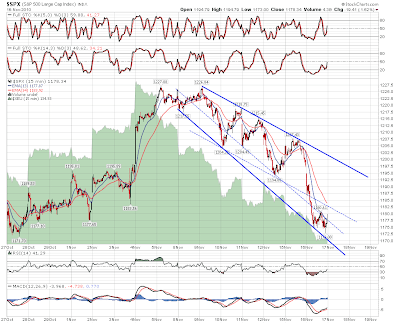
I'm expecting a bounce today. That could be the start of a fresh wave up and if so, the declining resistance trendlines that are the upper trendlines of these wedges will break up. That would be a strong long signal. If we reach those upper wedge trendlines today then resistance will be in the 1197.5 area for SPX and the 2122 area on Nasdaq.
Regardless of whether we break up from these patterns there is most likely one and perhaps two excellent entries there. The first is the short from declining resistance. Shorting declining patterns is always a nice trade as stops can be tight and within a short time your stop can be below your entry level. Going long is a lot chancier as there's always a significant risk of a second lower trendline hit further down. The possible second good entry is if those resistance levels are broken, as that would be a good entry level for the further upside that would then be extremely likely.
