
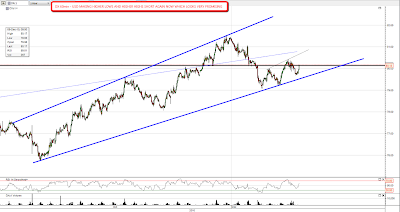
The USD reversal back up is looking pretty healthy this morning. Two higher highs and higher lows are in place and I'm looking for that to continue. If it does continue then equities will be fighting against USD for the rest of the current wave up:
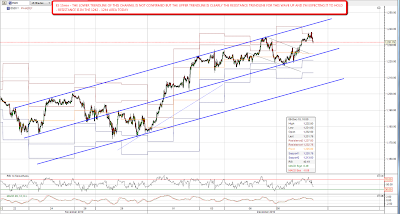
The retracement of the last two days has finished with ES making new highs overnight, but I'm expecting some choppy sideways to up action over the next few days. We have a well established resistance trendline on ES now and I'm not expecting that to be broken. Resistance is in the 1242 – 1244 area today:
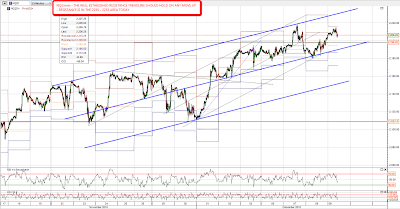
On NQ we also have a well established resistance trendline that should hold. Resistance is in the 2230 – 2233 area today:
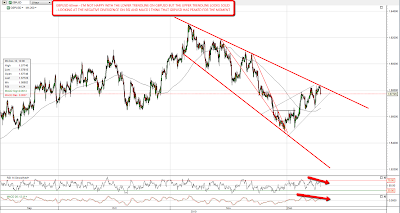
EURUSD is hard to chart at the moment and broke the obvious declining resistance trendline after breaking the obvious declining support trendline. That was particularly surprising as after the obvious declining support was broken I then called the low very accurately using a lower channel trendline derived from the (since also broken) declining resistance trendline. GBPUSD however has respected the declining resistance trendline from the high and looks ready to move down further here:
My long term silver chart that I posted yesterday was very popular and has since been viewed a frankly astonishing 9407 times, having been reposted somewhere with my IWM wedge chart which has been viewed 10224 times in the last day. At the risk of blowing out my screencast bandwidth here is my long term copper chart, which shows how very close copper is now to long term resistance:

As I've mentioned before I'm fairly convinced that we're close to a very significant equities wave top now and a number of 'risk on' markets seem to have topped already in November. I haven't got room to post those charts today but I'll be posting those this weekend in a separate post. I'll be looking there at China, Brazil, Emerging Markets and others and comparing recent action to that of a year ago before the major interim top on January 2010. One of my favorites is the chart for the Hang Seng where a clear H&S pattern is forming on the daily chart. Well worth a look.
