Slope of Hope Blog Posts

Slope initially began as a blog, so this is where most of the website’s content resides. Here we have tens of thousands of posts dating back over a decade. These are listed in reverse chronological order. Click on any category icon below to see posts tagged with that particular subject, or click on a word in the category cloud on the right side of the screen for more specific choices.

AAII Sentiment Survey – Week Ending 2/15 (by Ultra Trading)

By -

This week's AAII Investor Sentiment (asks of one's market view over the next six months) is out and still in the bullish camp.  Those answering bullish dropped 2.8% this week to a still above average 46.6%. Those answering bearish dropped 1.3% this week to a still below average of 25.6%.


The SPX continues to ignore prior correlations and the AAII sentiment data is yet another.  The charts below speak for themselves as the divergence over the past few months continues to grow new levels.


Submitted by Ultra Trading.  If you would like to read more, please visit - Ultra Trading

Opex Thursday (by Springheel Jack)

By -

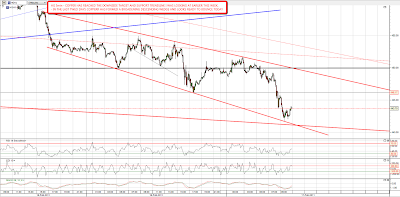
Opex going on in the background this week of course, which makes the week interesting to trade, though so far this week has been very nice to daytraders, and it's possible we might see more decent intraday action today. There are definite signs of rot however as on NQ the strong support trendline was broken slightly this morning with an hourly open below the trendline. That hasn't been followed through yet however, and the ES support trendline is still holding. The support trendlines on NQ and ES are solid and leave no room for interpretation, but the upper trendlines are trickier to pin down and I've been playing around with alternatives. I think I've nailed the short term resistance trendlines on both, though if we break down today those will become irrelevant of course. Here's the picture on NQ:

Here's the ES 60min chart:

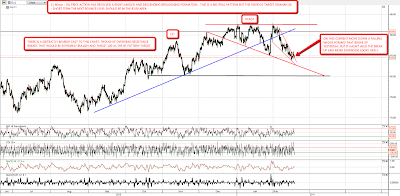
Copper had a bad night, and hit my initial target area. It has formed a broadening descending wedge on the move down and I'm looking for a retracement into the 448/9 area, though the bigger picture on copper still suggests more downside to me:

Oil looks interesting this morning. I've identified a right angled and descending broadening formation which is a neutral pattern but gives solid upside and downside targets as long as the pattern lasts. The overall setup on oil looks distinctly bearish too, though a break through upside resistance would immediately target the 100 level if we see that:

I've been watching EURUSD closely for signs of a major reversal. The jury's still out until it breaks up from the wedge, so ther real test should be at 1.365. If declining resistance is broken I'll be leaning strongly bullish on EURUSD but it could go either way:

We could continue the range trading of recent days today but overall the market looks very vulnerable here. Copper is often a good lead indicator and it has looked very weak this week, and may deteriorate considerably further. I gave a possible target for copper below 400 earlier this month and if we see a conviction break of 442 then I'll be looking at that again. If the support trendlines on NQ and ES break down we could see a very sharp correction on equities here.

Symmetry Everywhere

By -

I thought that it would be pertinent to post some interesting activity that seems to be coming to a conclusion imminently…yes, I know its been a rough slog for the bears…but the Nasdaq which has been a leader of the entire move off the lows and also was the harbinger of the biggest bear this side of 1980…has now completed a very symmetrical pattern. There is both time and price symmetry.

Markets love symmetry…and these levels definately have it!

The irony is that though this market has been pushing relentlessly there are these pretty significant road blocks…not the least of which are the 80 year trendlines on the DJ and the 30 year trendlines on the SP500…below are some things I think that should be kept in mind at this as the market seems to capitulate at these levels. (the SP and DJ monthly charts are from yesterday)

2011-02-16_2147_NDX_marked 
2011-02-14_2107_SPX_MonthlyTL 
2011-02-10_1253_DJ_Monthly 

In addition to some of these longer-term trendlines…the DJ Utilities look like they are starting to rollover after a lengthy and rather unimpressive retracement.

2011-02-16_2040_DJ_Utilities_marked 

How is Dr. Copper Feeling? (by Leaf_West)

By -

I have blogged in the past about how useful Copper is as an indicator of global economic health … it will often give us good signals in front of equity market pivot points/swing areas.

Read some of those blogs here …

Copper Hits 1st Wave 5 Target

FCX … What is Going On?

FCX/Copper … What is the Right Message?

What is Dr. Copper Saying ….

Below is the daily chart from the Copper ETN (JJC) …

JJC_Feb16, 2011_Daily

The chart is telling us an interesting story right now …. as discussed in a blog identified above, Copper hit its 61.8% Fibonnaci target for Wave 5 when it moved into the $61.60ish area.

Well since I wrote that article, Copper made a retest of that high and "failed" … price moved back to the 20EMA ($59.68) which is also right at the Wave 3 top of $59.6399 made on January 3, 2011.

I have called this level the "line in the sand" … if price breaks this level and stays under it on a closing basis for a couple of days, I would use that as your WARNING that equity markets are going to top here soon.

Keep you eyes on Dr. Copper!!!