The bounce most folks were expecting is in full force today, with just about all asset classes up. One thing I'd point out is that AIG, which had a terrific breakout on December 27th, has not only failed that horizontal line but has broken beneath its ascending trendline as well. This kind of failure of a bullish pattern is usually even more bearish than a bearish trendline break independent of anything else.
Slope of Hope Blog Posts
Slope initially began as a blog, so this is where most of the website’s content resides. Here we have tens of thousands of posts dating back over a decade. These are listed in reverse chronological order. Click on any category icon below to see posts tagged with that particular subject, or click on a word in the category cloud on the right side of the screen for more specific choices.
GDP Q4 2010 (by Ultra Trading)
Today's Q4 GDP revision was far below expectations. Originally reported at 3.17%, real GDP for the fourth quarter was revised down to 2.79% growth. Government, once a form of stimulus for economic growth has now become a drag at (.20%) of GDP. The consumer, thought to be strong came in weaker and was revised down as well by .16% although still contributing to growth.
Below is a summary of the original GDP versus the revisions. Overall, for an economy two years out of recession having experienced trillions in stimulus, this is not a good report. The data reported by BEA is real GDP and to convert from nominal to real the BEA uses two different inflation measures. They use a less aggressive number on the overall report yet on the import component which per the formula is a drag on GDP a more aggressive number. This questionable number many would argue easily overstates real GDP and in fact growth is far lower than reported.
Submitted by Ultra Trading. If you would like to read more, please visit - Ultra Trading
Testing Resistance (by Springheel Jack)
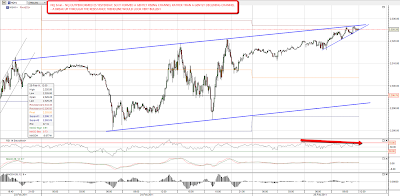
Yesterday's action looks quite a bit like a short term bottom at least, and overnight ES and NQ have risen to test the first real resistance levels that need to be taken out if we are to see further upside. ES formed a gently declining channel over the last day or so, and has broken up through that. It is still within the strong resistance zone at 1310-3 however, and a break over 1313 is needed to open the path to higher levels:

NQ was stronger than ES yesterday, which is generally bullish, and formed a channel that was rising rather than declining. It is testing resistance on that channel at the moment and a break above would be bullish:
Copper is reaching the next upside target at 439 at the upper trendline of the broadening descending wedge. A break above would be very bullish, and would suggest a move to the next resistance level at 450. A small rising wedge has formed on the way back up though, so it may fail at resistance. An hourly close over 439 would be bullish:

30yr treasuries have been rallying in recent days, which is bearish for equities, but after a test of strong resistance in the 122 area the recent support trendline has broken, so short term treasuries look likely to retrace:

EURUSD hasn't been an indicator for equities in recent days, and hasn't yet reached my next upside target slightly under 1.40, but a rising wedge has formed and now broken down in recent days, so EURUSD looks likely to retrace here. I've marked the likely targets on the chart:

Overall a mixed picture this morning and I'm leaning cautiously bearish until resistance is broken with confidence on ES, NQ and copper. If these all break up, then I will be leaning strongly bullish. Copper is one to watch this morning as it has been a good lead indicator recently. If it breaks up any retracement from resistance on equities is likely to be short-lived.
More Great Moments in Web Advertising
I was on ZeroHedge – a daily exercise – and saw there was a video of a Greek police officer who was on fire in the midst of a huge protest. I watched the video and noticed the advertisement that appeared beneath the poor fellow who was in flames.
Relative Strength for RIMM (Mike Paulenoff)
Research in Motion (RIMM) exhibits relative strength today despite overall market weakness. Let's take a fresh look at its big picture chart pattern.
From a relatively near-term pattern perspective, RIMM hurdled key 8-month resistance at 62.70-63.30 in early Feb and followed through to its Feb 18 high at 70.54. Since then, RIMM has pulled back about 8.5% right to the top of the prior resistance plateau — which is now important and substantial support.
The current pullback should represent a retest of that upside breakout point prior to the emergence of another upleg. RIMM should then head higher to fulfill the upside potential implied by the huge base formation that has developed since Sep 2008.
With such a powerful underlying pattern, it remains to be seen how RIMM behaves amidst otherwise "soft" overall market conditions. So far today, RIMM exhibits impressive relative strength, while both the SPX and NDX continue to weaken off of last week's highs.
Originally published on MPTrader.com.
