Slope of Hope Blog Posts

Slope initially began as a blog, so this is where most of the website’s content resides. Here we have tens of thousands of posts dating back over a decade. These are listed in reverse chronological order. Click on any category icon below to see posts tagged with that particular subject, or click on a word in the category cloud on the right side of the screen for more specific choices.

The US Dollar (by Runedge)

By -

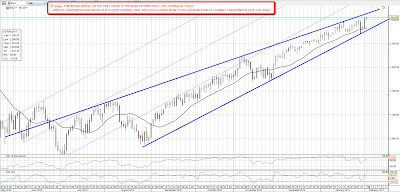
The USD cannot catch a bid.  No one seems to want it these days.  Below is a three year weekly chart of the DXY which has traded nicely within a narrowing range.  When QE2 was announced at Jackson Hole in August the USD continued its slide and then caught a bounce.  The bounce appears to be purely technical.  

That technical bounce though for the first time did pierce the trend line.  Granted it recovered the next day and moved back up but it looks to be a true "dead cat" bounce.  So here it is now ready to test the trend line again.  Literally by the time I finish this post it may break through.  Seems the only thing that can save the USD right now is either an end to QE, highly unlikely or some geopolitical risk that lasts beyond a day.  

If the trend line breaks then there is some near term support for perhaps another bounce at 76, then 74 then 70.  A true break though of this trend would be very bearish though.  It's rather concerning.  I saw a report today that extrapolated the prices paid component to the ISM manufacturing data to CPI 12 months out.  It forecasts 6.2% CPI.   How do people on fixed incomes, people struggling to make ends meet right now budget for such an increase?  How do companies manage margins for discretionary products where passing price along is almost impossible?  In the words of Larry Kudlow, inflation is a tax on the consumer.


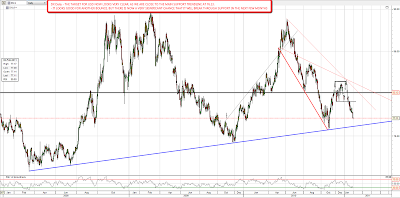
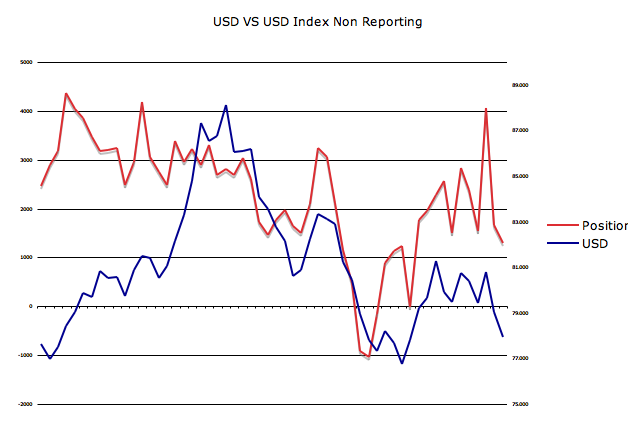
To get a sense of how traders are positioned the weekly CFTC COT report can be very useful.   Below are two charts comparing commercial net positions and non reporting net positions versus the USD.   The correlations are not very tight but I do think you can look at relative positions to get a sense of directional change.  

Commercial net positions per the chart below are at prior maximum net long positions where they have reversed in the past.  Over the past seven months this chart has had an inverse correlation so a decrease in net long positions implies USD strength.   Again, it's not very clear how to interpret this data other than to look at the relative net positions the past 14 months as charted below.


Non reporting net positions have moved very net short in a very brief period of time.  Knowing how the market likes to fade this group, it's quite possible a USD reversal occurs  purely to squeeze these positions. This group had been going more net long while the USD traded within a tight range and has been slow in getting net short as the USD has declined.


At some point, USD weakness will not be good for risk assets.  It already is not good for the American consumer.  Makes manufacturing reports look pretty in the short term until margin compression further hits employment causing even weaker demand.   

Submitted by Runedge. If you would like to follow my blog, please visit - Ultra Trading

A Better Morning

By -

Well, after yesterday, which was el stinko, I'm having a better day so far.

See, I have this sophisticated and complex investment philosophy which goes something like this (try to follow it, if you dare): I want my shorts to fall and my longs to rise.

As saucy as that may sound, that's really what I'm after, and I try to use charts on individual stock positions to make this happen.

This morning, things are working As God Intended. I have 21 longs and 68 shorts, and I am up 0.25% in the face of a market which is basically unchanged (as of this typing, for instance, IWM is up 0.03% and SPY is down 0.03%, so……unchanged).

Some of the better-performing longs are JASO, LDK, PCX, and RRR, which is shown below and which I mentioned yesterday. I love the recent volume strength.

0202-rrr

Targets and Broadening Tops (by Springheel Jack)

By -

That was a very impressive move up yesterday and there has been much talk about how this breakout is the start of a major new leg up. That's possible, and I'm expecting some more upside too, but I have a range of upside targets to lay out today, ranging from the modest to the downright scary.

The most modest, and the most credible IMO, comes from the rising wedge on the ES daily chart, which now looks extremely solid, with the latest ES low perfectly bouncing from the lower trendline of the wedge. The upper trendline is now in the 1311 – 1313 area if we were to hit it today. One thing to note about this is that I have mentioned before that rising wedges often evolve into rising channels. Usually they will break down to form the channel, but occasionally they can break up to do it and I have two candidate upper trendlines in the event that this wedge breaks up. That's worth bearing in mind:

On the ES 60min chart, the move up from November has now resolved into a perfect rising channel. The channel may be evolving into a broadening top as you can see from the red declining trendline from the last couple of weeks. and the upper trendline target is in the 1318 – 1320 area today. That's higher than the rising wedge target on the ES daily chart but it's worth bearing in mind that wedges often overthrow near the end and it's possible that the channel target could be met without breaking the rising wedge:

The scary chart I have to show this morning is the NQ chart, and this is the one that would fall into the major breakout category. Here there is a now very large broadening top with the upper trendline target in the 2430 – 2450 area. Supporting that target there is a possible continuation IHS with a target at 2400 that has formed in the last few days. I'm doubtful about this IHS but it is definitely worth bearing in mind:

Copper had a big break up yesterday, though oil and silver were strangely flat. EURUSD broke up to make a higher high again and I'm seeing a possible broadening formation on EURUSD that would give an immediate target of 1.388 – 1.39 before a reversal within the pattern to support at 1.3575:

On the bigger picture USD (DX) chart the target for this move is now obvious, as we are within 100 pips of the main support trendline, currently at 76.16. That should be good for a bounce, but it looks very bearish to me that the latest USD bounce was so small, and that it has fallen back to support without a significant retracement. I'm expecting that main support trendline may break in the next few weeks, and that is of course the logical consequence of the massive debasement of the US dollar that is being undertaken at the moment by the Fed. If it happens that break down will have major consequences, and may mark the beginning of the end of the Fed's current policy strategy:

For today, I was wondering whether support at 1300 ES and 2318 NQ would hold overnight and it has. As long as those levels hold I'm expecting another move up today. As to whether I think a top is still forming here? Well I'm mainly watching the rising wedge on ES for that and it is growing stronger by the day. For the last few months we have seen equities rise while treasuries tanked. Both are looking very good for some retracement here and that's still what I'm expecting to see. How long will that last? Hard to say, but the reversal scenario on both has been steadily strengthening in recent days and until we see a major breakout on either, that's still my primary scenario here. We haven't seen that breakout yet and forming tops tend to form on increasing volatility, which is exactly what we have been seeing for the last two weeks.

Emotion and Devotion

By -

Lately, the emotional atmosphere on the blog has been running a little on the hot side, and I wanted to address this. I've received a few emails complaining about "childish" behavior from some participants, and I've noticed a higher-than-average level of needling and snark.

I know as well as anyone that this blog has a lot of bear blood running through it, even though some superbly skilled bulls frequent it as well. And, as a "bearish blog" in an environment where the market is relentlessly moving higher, it's natural that there's a lot of disappointment and frustration going around.

I would hope that bears would not take this frustration and disappointment out on others, although in a couple of cases I've seen that, and for bulls, I would hpoe that gloating would be kept to a minimum (which,again, only has a couple of problematic cases).

Preserving a culture of inane chatter and puerile rantings is a cinch; browse the Yahoo message boards for evidence of that. Promoting and protecting a culture of respect, shared knowledge, and comraderie is hard. Slopers are able to do this most of the time because of who they are (well, 99% of them, anyway) and thanks to the commitment of folks like Iggy and Market Sniper. It's also due to the contribution of writers besides myself, such as Springheel Jack, Runedge, Leaf West, and many others.

I want people to feel good when they are on the blog, no matter what kind of day they are having. I don't like seeing fighting; I don't like seeing nastiness; I don't like seeing name-calling; and I don't like seeing ugly wishes laid bare. I'm all too human, and I've definitely had my "moments", but I think that, over the years, I've become about as good a citizen on the blog as I would hope others would be.

The vast majority of Slopers are fine, and this message isn't intended as a blog-wide scolding. It is simply meant as an expression of values and an affirmation that keeping this place welcoming and positive for all manner of traders is something that matters to me.

Thank you, and good luck to you all on Wednesday.