
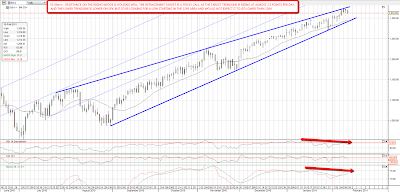
It's looking like we may not see the sharp retracement I was looking for here, as nothing has triggered a swift decline on ES yet. The target lower rising wedge trendline is move upwards at 2.5 points or so per day, so there's a chance that we'll just kick around in the 1300 – 1320 area until it is hit sometime next week. I've been considering retracement targets in the event that we can reach the trendline this week and I'd be ideally looking for a hit on the lower trendline of the wedge on ES in the 1295 area. The trendline looks lower on SPX though, so it might be that we'd go as low as 1284 support:
The retracement on EURUSD is proceeding well, and has formed a falling wedge, though it's early days and we need another hit on both trendlines to confirm the wedge. Short term EURUSD is forming an H&S that looks good to take EURUSD through support at 1.35. My retracement targets are the strong support levels below at either 1.34 or 1.326:

GBPUSD also looks weak here, and has formed a descending triangle, a pattern that breaks down 64% of the time, and the target is in the 1.585 area:

Flicking through the charts this morning long treasuries are looking due for a short term bounce here. They haven't reached the pattern target in the 115'24 area yet, so I'm expecting more downside when the bounce is finished:

Silver looks as though it may break down from the recent rising channel here, though we need an hourly close below the channel to confirm. Looking at RSI I'd expect a bounce after a break, perhaps to retest the broken trendline but possibly higher. If the channel breaks it will look an attractive short again. On the longer term picture I'm still expecting a deeper retracement than the one we have seen so far:

I've covered the short term bearish picture on copper very thoroughly this week, and it's still looking weak. I'll post an updated chart tomorrow when the shape of the decline has clarified somewhat. I'll do a chart on oil today as I've not covered the sharp decline this week. Oil was in a nice looking decline with the obvious target at 81.75 before Egypt blew up and now that Egypt is old news oil has resumed that downtrend. The broken rising channel has broken again and been retested. If we see a bounce at 81.75 then there's a possibility that we will be forming a large H&S with a target at 70:

I like using the hourly RSI as an indicator for significant highs and lows on many charts, and I've marked up some of the negative and positive divergences on some of the charts above. It doesn't catch them all, but it's always worth watching for these.
I'm expecting that we may well see an early bounce today and perhaps gap fill but I'm leaning sideways to short until we see a lower trendline hit on the main ES/SPX rising wedge. USD looks short term bullish, copper, oil and possibly silver short term bearish.
