Slope of Hope Blog Posts

Slope initially began as a blog, so this is where most of the website’s content resides. Here we have tens of thousands of posts dating back over a decade. These are listed in reverse chronological order. Click on any category icon below to see posts tagged with that particular subject, or click on a word in the category cloud on the right side of the screen for more specific choices.

Checking Up on the 30yr/2yr Yield Curve & GSR

By -

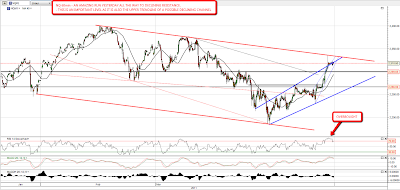
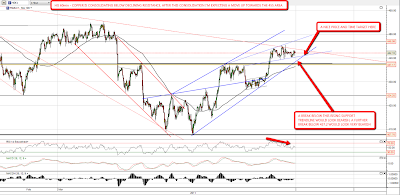
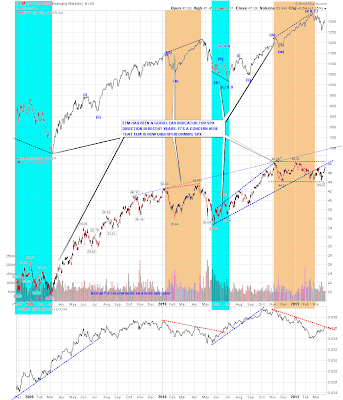
Dear Slopers, this is a chart I have looked at a few times in the recent past, since the curve began topping.  As long as the gold-silver ratio (GSR) declines, the casino is open for business.  Will the curve lead this time?  The reference to 'Otto' is regarding an exchange I had with a pal last week about Prechter's credibility.  

Just looking at this for the first time in a while, and I don't like it one bit.  Readers are free to have their own opinions.

Tyx.ust2y
 

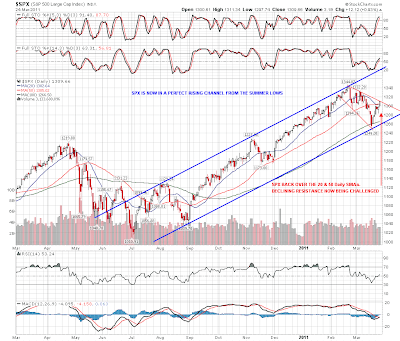
Everybody's getting bullish again, and the excuse is relief post-Japan, as decent economic numbers roll in (in some areas).  This is not an Armageddon blog and I am not a perma bear writer.  The fact is however, that the curve has turned down strongly, as it did in 2008, pre-crash.  Yet the Gold-Silver ratio has not yet responded (and may not, but then again…) by signaling an intense and acute liquidity suckage. 

I am just saying, you have profits?  It's legal to book some of 'em.  Cash is a position along with whatever else one favors.  Me?  I will wait for HUI to confirm something one way or the other.  I am bullish the gold stocks either way, but then again, I can stand 50 to 100 point swings on the HUI because I manage risk.  Probably sad (for me) to say, but this may include short silver once again, although more likely I'll look to book cash and short other areas. 

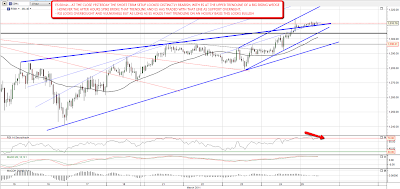
Sometimes it seems to be a curse looking at these below the deck indicators because they can sometimes scare the crap out of me while the party up on the upper deck rolls on.  Punch bowl and all. 

Sometimes I feel a bit like Prechter, poor discredited and lampooned soul that he is.  Last week's thing with Otto sticks with me, and I do not like the surety with which bulls hold to their case.  I was weened on Prechter, Hoye and yeah, a bunch of crazy gold bugs.  Thus, I do not have such a sure feeling that policy makers can/or will continue to promote the inflation, uninterrupted.  I have to remind myself that I was generally bullish when many of today's loudest, most staunch bulls were sucking their thumbs. 

So to repeat, I don't like this chart.  It may be nothing, but it may be something.

http://www.biiwii.blogspot.com
http://www.biiwii.com

Challenging Declining Resistance (by Springheel Jack)

By -

That was an amazing run yesterday, with NQ firmly back in the saddle leading equities up, which was bullish. SPX recaptured both the daily 20 and 50 SMAs, and NDX recaptured the 20 and stopped just under the 50. The main targets now are for NDX to move back above the 50, and a number of important declining resistance trendlines need to be broken. The first of those declining resistance trendlines is on the SPX daily chart, and if ES can hold the overnight gains then SPX will gap up over declining resistance this morning:

NQ spiked up to touch declining resistance from the high after hours yesterday, and breaking up through that is the next major target for NQ. That declining resistance trendline could be the upper trendline for a large declining channel, so that is an important level to recapture:

ES was at a bearish level at the close yesterday, as it stopped just below a candidate rising wedge upper trendline, and the short term setup was therefore looking distinctly bearish. The after hours spike up then took it through that trendline however and that broken trendline has acted as support for ES overnight. Both ES and NQ look overbought on the 60min, but as long as that support holds (currently at 1309.25), ES still looks bullish:

Copper is consolidating under declining resistance within a short term broadening ascending wedge. I'm leaning towards seeing that consolidate a bit longer, but an hourly close above 443.75 would signal that copper is breaking up. I have short term support at 440.50, rising support from the low at 438.75, and the IHS neckline at 437.75. A break of 437.75 with confidence would look very bearish but I'd be surprised to see that:

I post my EEM vs SPX chart regularly as an indicator and there are two important levels to watch there at the moment. The first level is the broken rising support trendline on EEM, which is close to a second retest. The second is the EEM:SPX relative trendline, where a break of declining resistance will signal that EEM has returned to outperforming SPX, which would look bullish:

Vix has collapsed in recent days, and is now back in the gap zone. This is the third attempt to close the open gap since the correction began and I'm watching to see whether Vix can close the gap this time:

Lastly for today I had a close look at gold futures after it dipped sharply yesterday, and noticed an interesting setup on the 60min chart, as it appears to be partway through an evolution from a rising wedge to a rising channel where (unusually) the lower channel support trendline has already been established. if this continues then it should move down into the 1415 to 1420 area before reversing back up. That would be an interesting long entry level:

NQ and ES are both overbought on the hourly charts and I wouldn't be at all surprised to see some consolidation today. ES has decent support at 1304 and 1300, and NQ at 2300. I'll be looking for good long entries on any dip and would like to see SPX close the week above the daily 50 and 20 SMAs.

Chart Analysis on SMH (by Mike Paulenoff)

By -

The Semiconductor HOLDRs (SMH) is acting "very technical" today, as the price structure gapped up, thrusting out of a near-term, base-like pattern. My near-term work argues that the SMH ended a significant correction at the March 16 low of 32.32, and has started a potent recovery rally at the very least and perhaps a new upleg in its larger bull trend from the August 2010 low at 24.14. The price thrust projects a next target of 35.25/75. As long as 33.25 is not violated on any weakness, the pattern looks very compelling near-term.

DL3wTa49P
Originally published on MPTrader.com.

Three Observations

By -

I'm not going to pretend to not be disappointed by the strength of the surge since last Wednesday. I expected a bounce, yes, but not to this degree. First, I will point out that the broken wedge is still very much in place, and we haven't violated anything to invalidate the pattern:

0324-ES

Second, the topping pattern for technology is more superb than ever. The bifurcation of the market continues this evening, with RIMM getting crushed and ORCL somewhat higher, so it'll be interesting to see how this all shakes out on Friday.

0324-MSH

Third, complacency has come sweeping back into the market with breathtaking speed. A week ago, the world was aghast at the deluge of bad news. Now, only days later, it's as if everything is just peaches 'n' cream, and nothing nasty has happened for years.

0324-VIX

Over the past week, I have become increasingly defensive. My portfolio is 60% committed to positions, 21% of which are long and 79% of which are short. At this point, the market's really going to have to turn over soon if this wedge is going to sustain any meaning or purpose.