
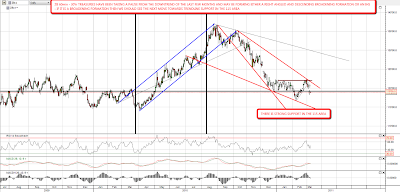
The picture has turned distinctly more bearish in the last day. Copper broke support at 445 and fell to support at 425, and made a fourth touch on a gently rising trendline there. A fourth touch on a trendline is often because that trendline is a neckline of course, and this could well be the neckline for an HS pattern. If so it would indicate to 383 on a neckline break. Positive divergence on RSI made a decent looking low on the 60min yesterday though, so I'd expect a bounce first:
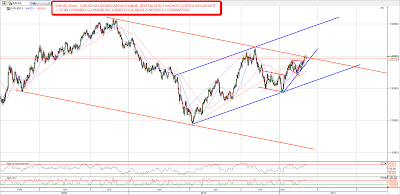
EURUSD broke channel resistance, but hasn't held above it. A daily close above is needed to confirm that USD has broken support and to open up targets much higher for EUR:
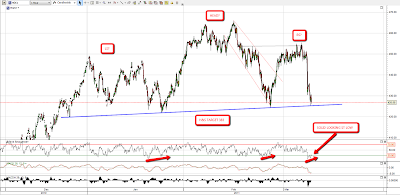
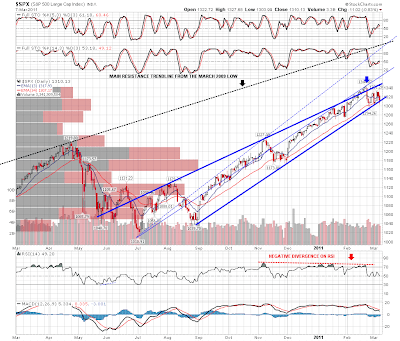
SPX tested main rising support again yesterday and pinocchioed slightly through it at the low. This trendline has been visited a bit too often now and I'm increasingly concerned that support won't hold:
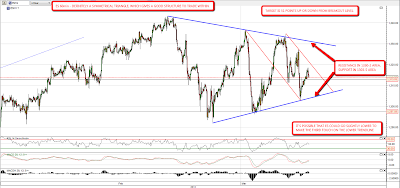
ES has now formed a nice symmetrical triangle on declining volume, though the touch yesterday was a little high and ES might return to touch 1301 today to make a better low. The next upside target is 1330-2 and the pattern top to bottom measures 51 points, which gives the target up or down from a breakout from the pattern. These patterns break up 54% of the time and the percentage meeting the price target is 66% on an upward breakout but only 48% on a downward breakout. Here's the link to the pattern stats at Bulkowski's Pattern Site:
Treasuries have been rallying in recent days and could be forming either of two patterns at the moment. The first pattern is an IHS with the neckline slightly over 122, but the right shoulder is looking too deep and treasuries haven't yet made the obvious downside target, which is strong support in the 115 area. The second pattern is a right angled and descending broadening formation, with the next downside target in the 115 area before either a break down from the pattern or return to 122 area resistance. These are a neutral pattern and can break out either way, though I'm looking for a break downwards to confirm the end of the 26 year declining channel on 30 year treasuries:
The likelihood of a downward breakout is considerably higher now, but the symmetrical triangle on ES gives shape to the current trading range. I'm wondering about an early move to triangle support at 1301 on ES, If that is broken with confidence then the pattern target is 1250. If if holds then the next upside target is 1330-2. As with yesterday, I'm watching copper closely for direction and a break with confidence of 425 support there would most likely also be followed by a break down on equities.
