Slope of Hope Blog Posts
Slope initially began as a blog, so this is where most of the website’s content resides. Here we have tens of thousands of posts dating back over a decade. These are listed in reverse chronological order. Click on any category icon below to see posts tagged with that particular subject, or click on a word in the category cloud on the right side of the screen for more specific choices.
Major Trendline Breaks (by Springheel Jack)
I posted charts on TLT, copper, and EURUSD yesterday, pointing out that they were all testing important trendlines that, if broken, should indicate major trend changes. They all broke yesterday. I thought that TLT might be saved by the S&P announcement yesterday, but having pulled back below the trendline by the open, it broke up through it in the afternoon:

This should be followed by a big bond rally. It makes sense that we would see that here as the recent highs on 30 year treasuries tested the 26 year old declining channel and the trendline was rejected. That's a shame for the longer term bear case, as there could be no better way of bringing current US policies to a close than seeing interest rates set firmly on an upward path, but it is what it is:

Copper broke down yesterday, and here's the daily chart showing what a significant break down this is. I have some support in the 410 and 400 areas but my main target is the 365 support level, which is also a potential H&S neckline if it's going to retrace further:

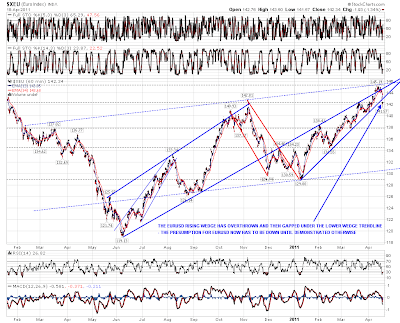
The trio of major breaks yesterday was completed by EURUSD, which gapped below the support trendline on the rising wedge that has formed since the last low at 1.29 in early January. Harder to put a target on the EURUSD retracement, but the technical target is back to that January low, and as the wedge overthrew, this wedge is unlikely to turn into a rising channel:
Taken together all of these breaks on bonds, copper and EURUSD augur badly for equities, with copper and bond yields particularly tending to track equities closely. My primary scenario is now that the February top on SPX was a major top and that it is now unlikely to be broken for a few months. We're also now coming into the seasonally weak May to November period of the year and this is a logical point to see a retracement on equities. Shorter term we still have two valid H&S patterns of the three that I posted yesterday morning, and they are the large IHS with the neckline at 1337, and the smaller H&S with the neckline at 1300. I'm taking the smaller H&S less seriously now as ES has broken back up over the neckline, though I'd only discount it altogether if ES gets back over 1315:

Equities are bouncing today and the logical targets on SPX are the 50 and 20 DMAs at 1315.25 and 1319.30 respectively. A break back above these with confidence would be bullish but until then they are the key resistance levels here:

I posted my daily gold chart a couple of weeks ago showing the very strong resistance trendline at 1450 and saying that a break above it would be very bullish. Since then gold has broken that trendline, retested it and is now testing the 1500 level. I wouldn't put any money on 1500 holding:

The bulls are on the back foot now and the technical picture favors the bears. The bulls still have the potential IHS, but the odds on it playing out have worsened considerably. The bears need a close below 1300 SPX and the bulls need to close back above 1320 SPX. I'm leaning towards seeing a bounce today but it may not get far.
S&P Upgrades Slope
Eye on Apple (Mike Paulenoff)
We could make the case that today Apple (AAPL) broke down from a 4-month top formation when it sliced beneath 328.00-326.00 support (now resistance). As long as AAPL continues to consolidate below 326-328, the bears will remain in directional control.
The next significant support plateau within Apple's powerful 2009-2011 uptrend is 307.50, which is the coordinate of the rising 200-day moving average. That said, however, the price structure today is probing its lower Bollinger Band line at 323.70. If AAPL weakness persists right into its earnings release Wednesday after the close, and AAPL presses about 1.5% to 2.0% beneath the lower BBnd line, then the intraday target window for AAPL during the next 48 hours likely will be in the 318.00-315.00 (again, prior to Wed's earnings).
Conversely, to get any traction on the upside — and to trigger signals that a significant near-term low has been established — AAPL must hurdle and sustain above 330-332.50.
Originally published on MPTrader.com.
SPY Update … (by Leaf_West)
Step back and look at the market action since mid February people …. my believe is that we are still in the process of making an important long-term top. These types of turning points take time with plenty of back and forth.
Here are a few charts to look at …
SPY Retracement Chart:
The SPY has pulled back to that all-important 50% retracement level that typically marks the turning point for pullback/retracements in a health trend. Also note that the lower Bollinger Band is situated just underneath this area as well ($129.38).
The Stochastic indicator is approaching an oversold level … people familiar with this indicator know that it is only good for use during Range trading and not in Trend trading. Therefore, as long as we are not about to take off in a trend move lower, it is flashing a buying area nearby.
Market Internals:
The market internals chart above shows that while the volume of selling here today is larger than any seen last week, it is not at levels seen during the down draft in March.
The amount of declining-advancing issues is however at levels seen at the beginning of the March sell-off. My reading of this chart tells me to expect a bounce tomorrow or at the latest on Wednesday. My plan is to not guess when it will occur but to be ready when the market tells me it wants to bounce higher.
NYSE Up – Down Volume:
This last chart looks closely at the up/down volume … again after the 12:30pm 60-min candle was put in, it showed that today's level of volume for down stocks was not at extreme levels.
Cheers … visit my blog
