For a long time Mondays were reliably bullish on SPX. No longer as SPX has closed down for the last six Mondays running, and eight of the last nine Mondays. Hard to say how this one will go, as EURUSD is bouncing after a very steep decline and both copper and silver have made nice intermediate lows with positive RSI divergence on the hourly chart. What is clear looking through various indices this morning though is that Dow, Transports and SPX have not made the obvious downside support trendlines. Here's the 60min SPX chart showing the downside target which is now in the 1323-5 area:

Nasdaq is harder to call, as there are two gap zones on the 60min chart and the upper one has been acting as good support. That may well hold even if the other indices dip a bit further to make their targets:

Looking at the Vix chart which has pinocchioed above the daily bollinger bands on each of the last two days, and then closed back within it, we have reached a significant resistance level which might deliver a bounce on equities. That's easiest to see on the 30min chart:

Notwithstanding any bounce this week though, I'm very doubtful that we've seen a major low on commodities, so I'm expecting this bounce to be a good time to pick short entries for the next move down. I don't have a good read on silver directly, but the position looks pretty clear on the gold daily chart, where there's a broadening ascending wedge extending back to the beginning of 2009. The support trendline is very strong with six touches and the downside target there would be in the 1350 area. As it happens however, there is an excellent alternative non-trendline target that must be considered, and that is support at the daily 150 SMA, which has also held six times since May 2009, and might hold again. The daily 150 SMA target would be in the 1400-1410 area. If the 150 SMA is broken, the wedge trendline should hold as support:

The move up in silver was so violent that all trendlines were broken, but the recent low almost reached the broken resistance trendline on the monthly chart that held from 2004 through to the end of 2010. That could hold as support, but if gold breaks the daily 150 SMA then it would be hard to see silver not retracing to the 30 area or below, with the obvious support then being at 28:

I thought I'd have a look at XLF today, as that is at an interesting stage. On the weekly chart declining resistance from the bubble high in 2007 is still holding:

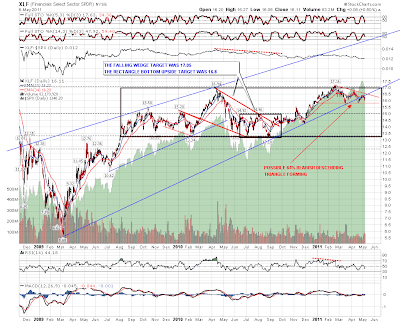
There isn't much in the way of strong trendlines on the XLF daily chart, but it's interesting that XLF peaked just above the target for the falling wedge in 2010, and there is clearly a strong resistance zone in the 17.0 – 17.2 area, and even stronger support in the 13.2 – 13.4 area. Overall XLF might well be in a bullish rectangle that has formed since August 2009, and if so I'd expect to see XLF break down towards rectangle support soon. A possible 64% bearish descending triangle is also forming, but we'd need to see another hit of declining resistance to strengthen the pattern:
Overall I think the odds favor a gap fill and consolidation today. Most of those down Mondays recently haven't been down much. If SPX can hit the support trendline in the 1323-5 area then we should see a strong bounce from there:
