Slope of Hope Blog Posts
Slope initially began as a blog, so this is where most of the website’s content resides. Here we have tens of thousands of posts dating back over a decade. These are listed in reverse chronological order. Click on any category icon below to see posts tagged with that particular subject, or click on a word in the category cloud on the right side of the screen for more specific choices.
Testing Resistance Again (by Springheel Jack)
That was a nice move up yesterday, but before the bulls can break out the champagne there's still the matter of declining resistance from the highs that needs to be broken. On the ES 60min chart that's the upper trendline of a bullish falling wedge, and we've already hit resistance. The oversold 60min RSI with some negative divergence suggest that may hold today. There's a possible upsloping IHS forming on the chart where making the right shoulder would involve a retracement to the 1326-1332 area:
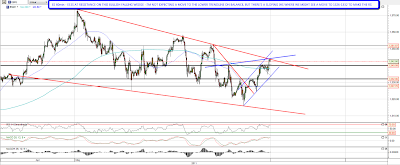
There's another falling wedge, somewhat sloppier, on the TF chart, and there's another possible IHS forming there with a possible retracement to the 830 area to make the right shoulder:

There were a couple of big gaps up on NDX recently, and the gap zones have been the key support areas for the subsequent move down. The lower gap zone held the last move down and the NDX high yesterday was back in the upper gap zone. This is logical area to see some retracement:

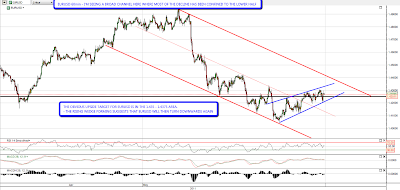
I've been asked a few times this week whether the USD rally impacts my view on equities and it does, but only marginally. The last five months of the equities wave up into April 2010 were in the face of a rallying dollar, and while a falling dollar helps equities rise, a rising dollar won't make equities fall. I'm expecting more upside on USD. Short term though, EURUSD looks likely to rally a bit more:
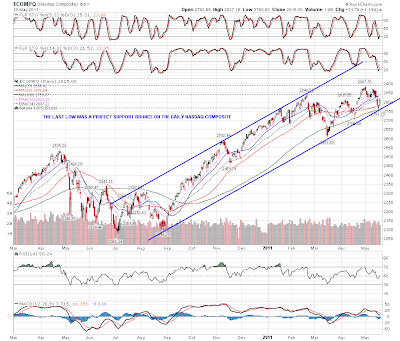
The risk with these falling wedges on ES and TF is that we see a move to test wedge support which would necessarily make new lows for the week. That would cause significant technical damage and I think that's unlikely but it's something to bear in mind. There were some good reasons to see a solid low at the bottom this week and one of the most compelling charts to see that is the Nasdaq Composite ($COMPQ), which I don't usually follow much as I prefer NDX. On COMPQ the low was a perfect bounce at channel support from the summer lows last year:
I was looking at the FTSE this morning. Stockcharts has just added support for a lot of UK and european equities and I'll be watching those markets more in the future as a result. The FTSE looks interesting at the moment, with a possible continuation IHS forming on the daily chart that could take FTSE back close to the 2007 highs:

One difficulty with continuation IHSes though is that there's often little to distinguish them from double or triple tops. Looking at the broader view on the 5 year weekly chart, the similarity between the current setup and the FTSE top in 2007 is very striking. Not a long trade to to taken before there is a new high with some confidence really:

I'm leaning towards seeing some retracement today on balance, though a break up with confidence through declining resistance on TF and ES might change that. I'm expecting those trendlines to be broken in the next few days, and that would be the signal to expect new highs, but I'd be surprised to see that today.
Pushing Into Overhead Supply
I entered into Tuesday morning not only 100% short, but with all my cash and even some margin funds committed to those positions. Ever since then, due to my belief that we were heading for a minor relief bounce, I backed way off, and now I'm about 60% committed.
I had hoped that GDX would provide me a great hedge for the bounce, but it didn't. Yes, it went up, but its performance was really quite flaccid. At this point, I have no longs, because the one long I felt had short-term potential, GDX, went limp. I'm satisfied being totally short but "light" in terms of my commitment.
As I look at the intraday charts, I see the same story – – a market which is fighting its way back into a huge blob over overhead supply. Here we have the DIA, whose trendlines are particularly clean.
Next is the IWM, which is sporting a wonderful H&S pattern and has, for the entire month, been tracing out a clean set of lower highs.
The commodity ETF, shown below, also has made a very straightforward series of lower highs, as well as being under an important horizontal price level.
Finally, and perhaps most importantly, it only took a couple of days for all the fear to get vacuumed out of the market once again. Even if we do get more strength Thursday, I've got other good shorts I'd like to enter at higher prices. I don't mind the strength at this time (although obviously I hope it abates before too long).
The Waiting
Sloppy
I must say, the miners are not doing what I had expected. Yes, GDX broke out of its pattern beautifully (as I suspected it would yesterday, way back when it was at $54) but – instead of soaring gracefully like a bird to $57.50, it has instead plopped like a bird poop on its neckline. We'll see what happens here, but if it just rolls over and fails the pattern, then the bulls might not even give the two or three day reprieve I thought they would.
