Slope of Hope Blog Posts
Slope initially began as a blog, so this is where most of the website’s content resides. Here we have tens of thousands of posts dating back over a decade. These are listed in reverse chronological order. Click on any category icon below to see posts tagged with that particular subject, or click on a word in the category cloud on the right side of the screen for more specific choices.
Chart Analysis on EWH (by Mike Paulenoff)
All of the action in the iShares MSCI Hong Kong Index (EWH) from the November 8, 2010 high at 20.24 into the March 17 low at 17.63 has the right look of a completed major corrective period. If accurate, that means that all of the action since March 17 (at 17.63) is part of a new upleg within the dominant, powerful uptrend. Last Thursday's low at 18.79 ended a minor pullback ahead of a thrust that should confront the November 2010 to May 2011 resistance line, now at 19.56. If hurdled, this should trigger upside follow-through to new highs.
Only a decline that breaks last Thursday's low will begin to compromise the timing of the anticipated next unplug.
Originally published on MPTrader.com.
Euro Retracement?
I was intrigued to see how nearly the EUR/USD push up to its failed trendline:
One has to wonder if that was it, or if the Euro will find more strength later. I'm leaning toward the "that's it" camp.
Bearish Monday (by Springheel Jack)
For a long time Mondays were reliably bullish on SPX. No longer as SPX has closed down for the last six Mondays running, and eight of the last nine Mondays. Hard to say how this one will go, as EURUSD is bouncing after a very steep decline and both copper and silver have made nice intermediate lows with positive RSI divergence on the hourly chart. What is clear looking through various indices this morning though is that Dow, Transports and SPX have not made the obvious downside support trendlines. Here's the 60min SPX chart showing the downside target which is now in the 1323-5 area:

Nasdaq is harder to call, as there are two gap zones on the 60min chart and the upper one has been acting as good support. That may well hold even if the other indices dip a bit further to make their targets:

Looking at the Vix chart which has pinocchioed above the daily bollinger bands on each of the last two days, and then closed back within it, we have reached a significant resistance level which might deliver a bounce on equities. That's easiest to see on the 30min chart:

Notwithstanding any bounce this week though, I'm very doubtful that we've seen a major low on commodities, so I'm expecting this bounce to be a good time to pick short entries for the next move down. I don't have a good read on silver directly, but the position looks pretty clear on the gold daily chart, where there's a broadening ascending wedge extending back to the beginning of 2009. The support trendline is very strong with six touches and the downside target there would be in the 1350 area. As it happens however, there is an excellent alternative non-trendline target that must be considered, and that is support at the daily 150 SMA, which has also held six times since May 2009, and might hold again. The daily 150 SMA target would be in the 1400-1410 area. If the 150 SMA is broken, the wedge trendline should hold as support:

The move up in silver was so violent that all trendlines were broken, but the recent low almost reached the broken resistance trendline on the monthly chart that held from 2004 through to the end of 2010. That could hold as support, but if gold breaks the daily 150 SMA then it would be hard to see silver not retracing to the 30 area or below, with the obvious support then being at 28:

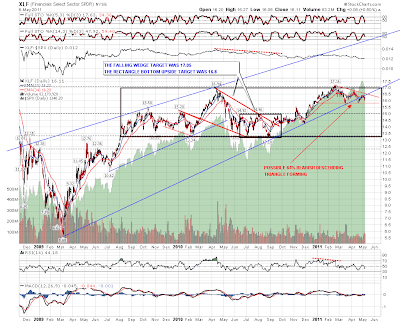
I thought I'd have a look at XLF today, as that is at an interesting stage. On the weekly chart declining resistance from the bubble high in 2007 is still holding:

There isn't much in the way of strong trendlines on the XLF daily chart, but it's interesting that XLF peaked just above the target for the falling wedge in 2010, and there is clearly a strong resistance zone in the 17.0 – 17.2 area, and even stronger support in the 13.2 – 13.4 area. Overall XLF might well be in a bullish rectangle that has formed since August 2009, and if so I'd expect to see XLF break down towards rectangle support soon. A possible 64% bearish descending triangle is also forming, but we'd need to see another hit of declining resistance to strengthen the pattern:
Overall I think the odds favor a gap fill and consolidation today. Most of those down Mondays recently haven't been down much. If SPX can hit the support trendline in the 1323-5 area then we should see a strong bounce from there:
Guideposts
My biggest problem right now with my analysis is that I don't want the repeated disappointments of the past eight months overly-cloud my thinking with respect to the markets. The disappointments are legion – – Egypt, Libya, the Japanese nuclear disaster….I've really started to lose track of it all – – – which are the instances of the market beginning to break and then rapidly recovering to new highs.
The irony of last week's selloff is that it was based on good news instead of bad. That's actually encouraging. It all began last Sunday with the out-of-the-blue drop in silver futures, and when the OBL killing hit the wires, equities soared, only to give it all up later. And on Thursday when I said to pray for a rally, we got our prayers answered with a rally that, just as I had hoped, almost completely faded by day's end.
If I was forbidden from watching any stock indexes, I could content myself with watching silver all by itself as a signal about when to get really aggressive about shorts again. The charts below – the Euro, gold, oil services, and silver, all are painting the same picture for me: a possible bounce to clearly-defined levels, and then a resumption of the downturn. Just as I had hoped for a rally at the end of last week, I likewise would be delighted to see a nice rally Monday. It would making adding to my shorts much more comfortable.
As it is now, my portfolio is about a 20/80 bull/bear split, with the largest bullish position being UDN (betting on weakness in the US dollar). I am preparing myself to move to a 0/150 split if we can push to the levels suggested below (that is, entirely short, and using margin).
