Slope of Hope Blog Posts

Slope initially began as a blog, so this is where most of the website’s content resides. Here we have tens of thousands of posts dating back over a decade. These are listed in reverse chronological order. Click on any category icon below to see posts tagged with that particular subject, or click on a word in the category cloud on the right side of the screen for more specific choices.

Testing Support and USD (by Springheel Jack)

By -

That was a beautiful high yesterday. We spent all day bumping up against resistance and making marginally higher highs on sharply negative divergence on the 60min RSIs, then fell hard at the close and have fallen further overnight. The main index I'm watching today is NQ, as that is the index with the very nice looking IHS forming at the moment. As I said yesterday I'm expecting the ideal low for the right shoulder on NQ in the 2210-20 area, and the overnight low is 2216.25 so far. I'm expecting a little lower but that could be it. Any lower than 2200 today and the IHS is in trouble, with a strong possibility of a break further downwards:

On ES the first support level at 1276 I gave yesterday didn't hold overnight, but we're still above the second at 1270. Rising support is at 1265 and a break there would strongly suggest a retest of the lows:

On TF, the rectangle upper trendline at 793 didn't hold overnight. I'm seeing some support at 789 and 790. Much lower and a retest of the lows near 772 would look likely:

Just as an aside before I start talking about USD, GDX broke up through the potential IHS neckline at 54 yesterday and I'm seeing likely support on a retracement today in the 53.5 to 54 area:

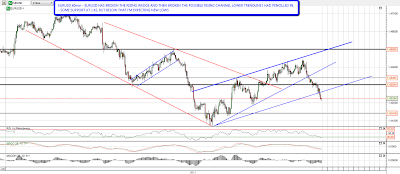
USD is looking interesting today, though I was going to talk about it in detail even before EURUSD broke support overnight.The rising wedge on EURUSD has broken down and has also broken the potential rising wedge upper trendline from the top of the rising wedge. There's some support in the 1.42 area but beyond that a move to retest the lows looks very likely:

I've been having a careful look at USD and the main USD currency pairs yesterday and thought I'd post a couple of the most interesting charts. The most interesting chart is on UUP, where there is a very high quality falling wedge from the June 2010 highs. What this chart says to me is that any new lows on USD, if we see those at all, are likely to be marginal, and when the falling wedge breaks up it may break up hard and run a long way. If there's to be no QE3, that seems very credible:

The other interesting USD-related chart is for CADUSD, where a decent quality rising wedge from the 2009 lows has broken down and is now retesting the broken lower trendline. CAD just recover that trendline back intro the wedge, but new highs looks ambitious from here and overall upside looks very limited:

Altogether it looks to me as though USD has bottomed already, or is likely to bottom soon at a marginal new low. That's worth watching, as it may have big implications for bonds and equities over the next few months. 

For today we are at or near my target lows on ES, NQ and TF. I'm expecting these to hold and not drop much further. If we do see a sharp move down from here then I'd expect a retest of the lows, though I'm not expecting that at the moment. If the NQ IHS continues to form then we may see equities stay near the overnight lows much or all of the day, and the IHS target would then be at 2325, which is a 5% move up from here.

Oh, Those Fickle Slopers….

By -

You guys just kill me. Seriously.

If the market goes up one or two days:

+ All the bears vanish (your host notwithstanding);

+ The guys who love to be bulls get really loud about it;

+ The Hun shows up.

Just two days ago, everyone was convinced – absolutely convinced – the S&P was heading toward 1400 or 1450. Nonsense. The bull run ended in April, and the bears are back in control.

Just as the bears could only get two or three days of relief during the Bernanke-fueled fraud-rally, now the bulls get a taste of their own medicine.

While the market was lurching higher, and all of you were panicking, I made my Come to Papa post and put this at the top of the comments section:

"The speed with which some Slopers become scaredy-cats requires high-end scientific instruments on days like this. Incredible. "

There was even talk of "smart floor traders" (ha!) talking about 1650 on the S&P this year. Jesus, guys. What's with you?!?!?

This is not to say it's a free-fall down to zero. God knows I wish it were, since that would be glorious fun, but there are going to be fits and starts. I have been very, very light until yesterday, and thank goodness, because I side-stepped almost all of that fraud-strength. But, as I made clear yesterday, I am short 75 (out of 200 targeted) positions.

Now, as I've also made clear, some stocks seemed ready for a bounce, and I am long 16 stocks now, and I imagine at the opening bell I will wish I had 16 fewer longs than I do right now. Such is the price to pay for uncertainty.

My point isn't that the market is now going into a free-fall. As I'm typing this, we might be seeing the lows of the day – who knows? But just as Bin Laden's capture marked a top, the Bernanke ego-stroking-fest yesterday might also mark a small top, and the cold fact is that out of the 1000+ stocks I look at each day, maybe 10 of them look like good longs. There are a ton of delicious-looking shorts out there, and my view is that, starting on May 1, the torch was passed to the good guys.

Whistling Past The Graveyard (by Goatmug)

By -

WHISTLING PAST THE GRAVEYARD

This week has already been very interesting.  We've had the confidence vote for Greece, which means that we'll have more Greek default discussions and posts in the near future.  We also had the FOMC meeting and press conference today where Ben Bernanke seemed much less confident.  I almost feel like the market is whistling past the graveyard in hopes of not disturbing the situation.  Over the last couple of days I've sold many of my shorts and waited for an expected bounce. 

Now that we've had some of a relief rally, I'm focused on two specific names that seem to have attributes of weakness.  Specifically, GS has entered a significant period of decline where the 14 day EMA has crossed over the 40 day EMA.  There seems to be some support at $131 for the broker, but it may be worth a shot with the opportunity for a much deeper decline.  FXI also is showing the same qualities although it has not officially crossed over (I expect it to be official at the end of this week).  The "crossover" usually portends nastier things to come.

From a macro perspective we have two issues that will help these trades.  We have the Fed removing stimulus (no better said, not stimulating and that should deprive GS of some trading proceeds at our expense) and also China is slowing and confronting inflation while trying desperately to keep from a hard-landing. 

FXI – Weekly 14/40 EMA Crossover pending.

FXI (3 Yr Weekly)

GS Weekly View – 13/40 EMA Crossover 

Goldman Sachs (GS) 10 Year Weekly

The 10 Year view of GS is really interesting.  There is an obvious risk that GS could go up to around $165, but with all the uncertainty and misery in global credit markets it may be worth a short shot.  I think a move below $131 could take us to the lower portion of the downward channel which is at $115 which just happens to be the level that Warren Buffett got his shares.  It would be really interesting to see GS back at those same levels wouldn't it?

Remember to come by the blog at www.goatmug.blogspot.com I've really made an effort to post more in these uncertain times and it is important that you remain in tune with the perils we face!