Well I'm out of hospital and getting used to getting round on crutches (Editor's Note – we have here further proof that Slopers are tough traders!). Getting fully back to my usual routine is still hampered by having to spend much of the day with my broken leg up for the next week or so, and by the significant amounts of opiates I am taking which are making me a bit groggy. Nonetheless I've been having a good look at some charts this morning and if everyone will cut me some slack for my codeine-tinted vision then I have some interesting charts to show today. Many thanks for all the supportive messages from everybody this week :-).
I've been caught somewhat by surprise by this latest reversal this week, which I wasn't expecting after the ES break up through declining resistance before Tuesday's open. The reversal is significant, but hasn't yet done any major technical damage, and to see why I'll post the updated and unamended versions of the RUT and NDX daily charts that I posted on Thursday last week so you can see what I mean. Here it is on NDX:

Here it is on RUT and you can see that NDX and RUT have both touched again, and so far bounced precisely at, the channel support trendlines I posted last week. That's not to see that equities won't decline further, but it underlines that significant support is still holding so far, and that we reached a possible bounce level yesterday:

One thing we're not seeing on this move down is any support from a falling EURUSD so far. EURUSD has been in a tight uptrend channel since the recent low and the equities waterfall this week hasn't halted that rise so far:

Copper is still holding an uptrend as well, though the rising wedge forming looks bearish and we may see a quick move to 395, and possibly 385, if short term support breaks:

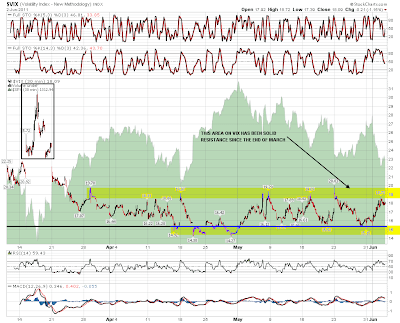
As I'm writing ES is testing 1295 and those trendlines on NDX and RUT look likely to break at the open. A strong move down today could move us out of the current trading range on Vix that's been holding since March:
I posted the four year chart of the SPX daily bollinger bands last week to show that there was almost always a strong rally after a break down through the daily bollinger bands on SPX. We saw that strong rally afterwards last week and if the pre-market fall on SPX is sustained, SPX will break down through the daily BBs again today. Thanks again to Pug for posting the original of this excellent chart:

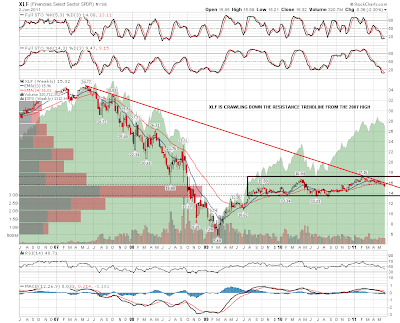
As an aside the longer term XLF chart is looking very interesting this morning, with XLF still crawling down declining resistance from the 2007 high. There's definitely scope for XLF to move back down below 14 within the two year trading range since August 2009:
I'm seeing some immediate support for ES at the 1295 level today, and there's a possible H&S neckline in the 1290 area slightly below. If we do break down out of the SPX daily bollinger bands today then I'll be looking for a short term low to be established on SPX today or Monday that should deliver at least a decent bounce. I'll be having a broader look over the weekend to see whether I can get a better idea of where this is headed, though a retest of the March lows in the next few weeks as Pug and others are expecting seems very possible from here.
