This whole cyclical bull market was either an a-b-c correction during a secular downtrend, or– if this trendline holds and prices make a new high– that changes the structure to a five wave advance!
Slope of Hope Blog Posts
Slope initially began as a blog, so this is where most of the website’s content resides. Here we have tens of thousands of posts dating back over a decade. These are listed in reverse chronological order. Click on any category icon below to see posts tagged with that particular subject, or click on a word in the category cloud on the right side of the screen for more specific choices.
Pull Back (by George Rahal)
Prices have halted their advance over the last few trading days, with many indexes near their February highs, and some above. The latter (first two charts below) actually give a clearer visual clue as to why to expect a pull back. The third chart has a zone of where my analysis suggests a pull back would end on the S&P 500; either at a slightly higher high from the most recent 15 point reaction, or back to the 1300s for prices to form an inverse H&S. However, I would not sell (short) because there is a possibility of an upside breakout.
All charts are in 30 min bars.
Lessons in Sentiment (by George Rahal)
There was a powerful uptrend in the stock market from September 2010 to February 2011, interrupted by one correction in November. I have anecdotally observed that 1344 exceeded the price target that many were expecting before another correction would ensue.
Throughout much of this trend, as early as December when the S&P 500 was in the low 1200s, high levels of bullishness, measured by investor polls and option put/call ratios, were often quoted as a reason to expect a 5% or greater correction. I was also guilty of these forecasts, embarrassingly early.
What have I learned? For anticipating market turning points, extreme bullish or bearishness is only part of the sentiment picture. This sentiment sets the conditions for what I am hypothesizing is a better sentiment-based timing tool—that is, capitulation. Synonymous with surrender, this is the preferred term in finance for two similar behaviors. First, capitulation is when investors who have held on to positions during a bear market with the tenet that “prices always go back up,” finally cannot endure the pain of seeing the value of their accounts drop, and decide to sell. This is an event that defines a primary trend. Smaller trends and turning points can be affected by the second type of capitulation, in which the callers of a bottom in a bear market give up and turn bearish, or the callers of a top in a bull market give up and turn bullish.
It is not extreme sentiment that will cause the market to turn, but rather, capitulation. One would expect capitulation to occur in an environment of extreme sentiment. As long as there is a significant enough group of individuals calling for a top, there may be 1) short sellers and 2) buyers on the sideline, not wanting to enter at a top. A top occurs once there are no buyers left—investors on the sidelines can still buy and shorts must buy to cover positions. These two groups must be converted before the actual top is printed.
A great and sad irony results from these phenomena. If capitulation is a necessary condition for a top or a bottom, then the market will not turn until it occurs. Think about that. As long as a group of individuals hold on to their belief that the markets will turn, the markets won’t turn. The majority’s conviction must be broken because this conversion, ipso facto, caps off the trend.
Sometimes, capitulation is identifiable by major spikes in volume coupled with parabolic moves in what are called blow-off tops and panic bottoms. There are no polls set to capture this type of surrender, per se. What one must identify is the conversion of bulls to bear or of bears to bulls, not the absolute level of each. To do so, one must scout for viable anecdotal evidence. Perhaps technical tools can be devised to measure this conversion.
In summary, in an environment of extreme sentiment, one must look and wait for capitulation in order to better time a turning point. For this to happen, I hypothesize that the majority of countertrend forecasters or traders, by necessity, have to convert. Until they do so, an established trend will continue.
(To read other market-themed essays, please visit my site .)
GLD Will Peak at 136 (by George Rahal)
The image below is of gold and three established bubbles, the Nikkei in the
80s, the Nasdaq leading up to 2000, the Shanghai Composite Index leading
up to 2007.
In the charts, the boxes are equal in length. I took the entire length of a strong leg and doubled, or tripled it. This worked very well at picking tops. This analysis yields a peak at 136 for GLD, which is only 10.7% higher than today's closing price.
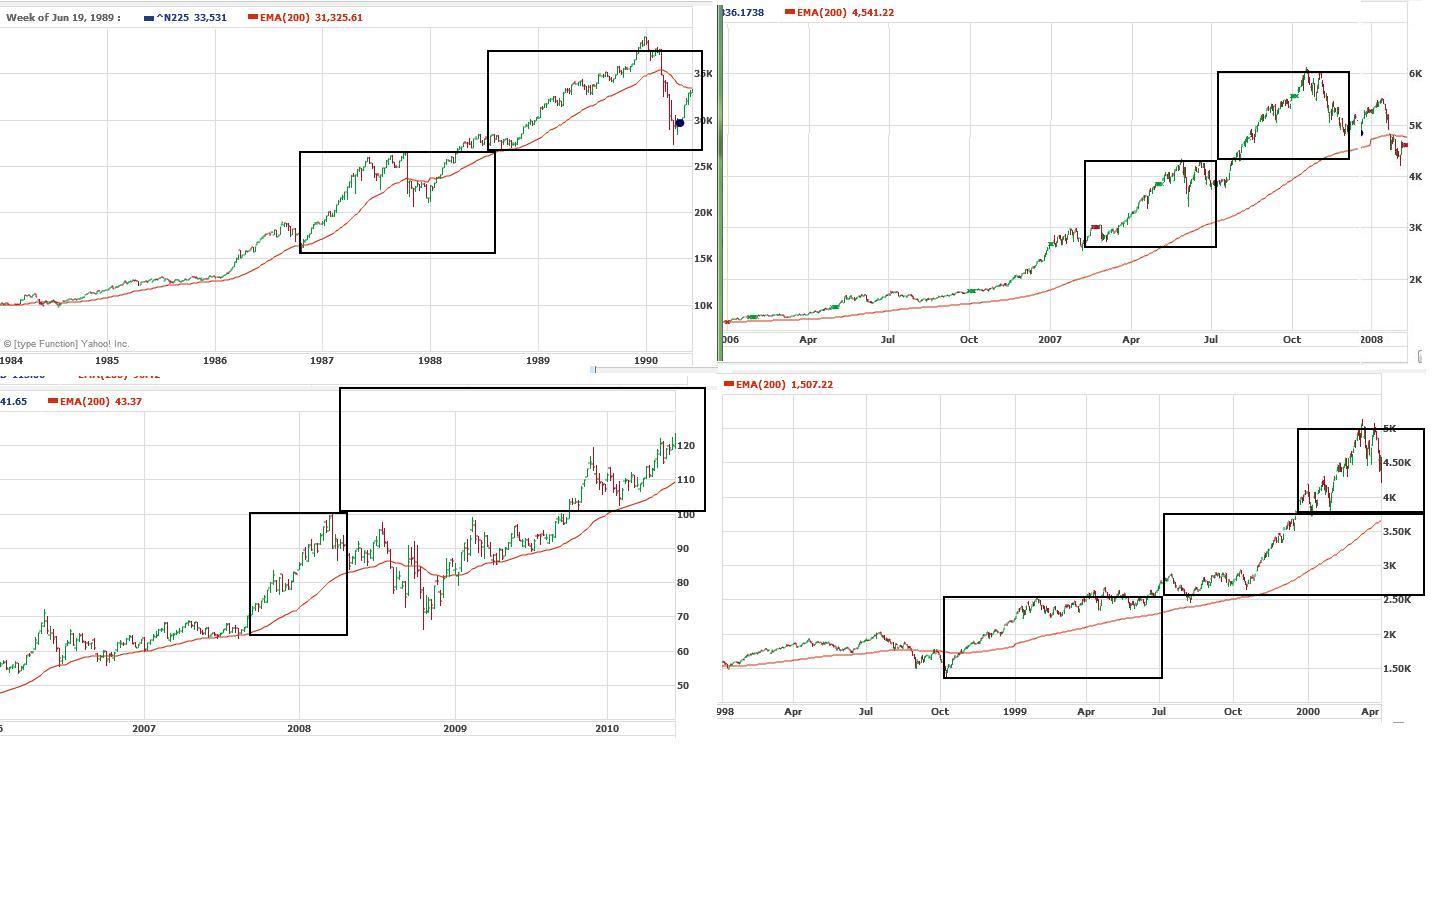
The peak may occur
when the European bank stress test results are announced late July; sell the
news. It is no accident that shortly after the announcement in the evening of 6/17/10 of a specified time period during which the stress-test results would be released, gold definitively broke out of its previous highs. The long term target following the 136 peak is 68.
Bear Market in Gold (by George Rahal)
Golden lads and lasses must,
As chimney-sweepers, come to dust.
Gold is ontologically a commodity, store of value, and currency. We have all heard the bullish gold arguments. The charts say otherwise.
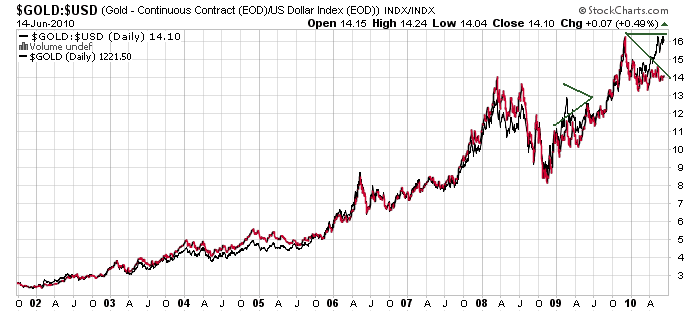
Gold as a commodity:

Above is the ratio of gold to the commodity index. Note how this ratio made the first of two tops much earlier than gold; it is losing momentum. Also note the second T. It has expired on point. I interpret the accurate inverse T as framing the time period in which gold underperformed. Finally, the pattern during the T rise resembles the many fractals I observed that preceded market crashes.
Gold as a safe haven:

Plotted above is the ratio of gold to a precious metals index. The bubble burst October of 2008, at the peak of the market panic.
Gold as a currency:
Gold to the dollar versus gold. This is a bullish chart confirming that gold had a great bull run. However, in the eight years I have plotted, I have only noticed two divergences, one positive one negative. The positive one occurred a mere few weeks prior to gold breaking the 1000 level. A very pronounced negative divergence is present in recent history.
GOLD – THREE PEAKS AND DOMED HOUSE:

Most
numbers match up well, but I just placed select ones. Point 25 will
probably coincide with a stock market decline and a piece of news that
justifies the gold safe-haven trade; then, sell the news. Based on this
analysis, the target price is 680.
Also note the historical
inverse relationship between gold and the US dollar: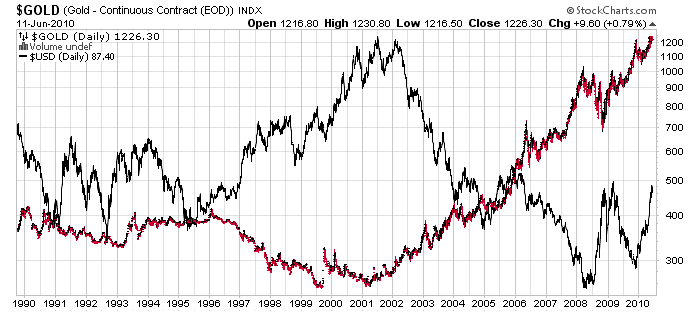
One
of these two will win out, and my bet is the dollar (although due for a
ST pullback.) There will be a
flight to safety in US Treasuries when the bear market in equities kicks
off; foreign investors will need dollars to buy treasuries, which will
also boost the currency's value.
These studies (and others) lead me to conclude that Gold in the next few years will be in a bear market. I also believe we are inches from its peak; a false break above the recent high. The fundamental forces of deflation and an appreciating US dollar will be the main causes of this bear market.
