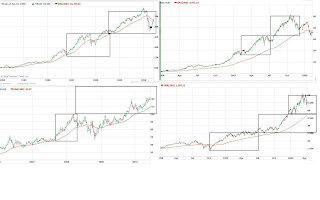
The image below is of gold and three established bubbles, the Nikkei in the
80s, the Nasdaq leading up to 2000, the Shanghai Composite Index leading
up to 2007.
In the charts, the boxes are equal in length. I took the entire length of a strong leg and doubled, or tripled it. This worked very well at picking tops. This analysis yields a peak at 136 for GLD, which is only 10.7% higher than today's closing price.
The peak may occur
when the European bank stress test results are announced late July; sell the
news. It is no accident that shortly after the announcement in the evening of 6/17/10 of a specified time period during which the stress-test results would be released, gold definitively broke out of its previous highs. The long term target following the 136 peak is 68.


