
The more that I look at market action the last few days the grimmer it looks for the bears here in my view. They're not out of the game yet, and with earnings season starting next week they may yet be rescued by bad earnings, but equally they may not be.
The real hope of the bears here is that equities fall in the absence of fresh QE. There's still a bit of QE coming into the market of course, with the Fed reinvesting treasury capital as they mature at the rate of (I understand) about $250bn a year, but the overall level of Fed treasury holdings will stay flat unless there's a QE3, and that therefore raises why in my view are the real questions about QE's impact on the market, which is whether equities can rise much with a trillion dollars or more of US deficits every year being financed with capital that would otherwise be going into other markets, and what long term interest rates would have to rise to to pull in that kind of money away from other markets and into treasuries? Those may be longer term questions though, and the impact of that sucking out of funds away equities and other investments could well take a few months to have a real impact.
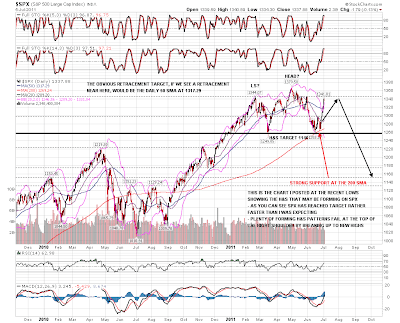
For the moment the bears' main hope here is obviously the H&S forming on the SPX daily chart. I haven't annotated this chart much since I posted it at the lows and you can see that SPX hasn't yet quite reached my ideal target at the February highs for the top of the right shoulder, and that we have reached this current level a lot faster than I was expecting. I have added to the chart my preferred target if we see a retracement here which is the daily 50 SMA currently at 1317.29 SPX:
In terms of whether we see that retracement I'm using the 15min charts, as that's the only way to properly show the now decent quality channels that have formed on the equity indices since the start of last week. First up is SPX, where SPX has formed a rising channel and broke it yesterday. What's worth noting here though is the little rectangle that has formed at the top. These are a 69% bullish pattern of course, and we could see a last little push up into 1347 to make the rectangle target. I've used EURUSD as the background to this chart to show how SPX has merely traded sideways while EURUSD has been retracing. That is something that is generally seen during a bull wave up on equities rather than a corrective move:

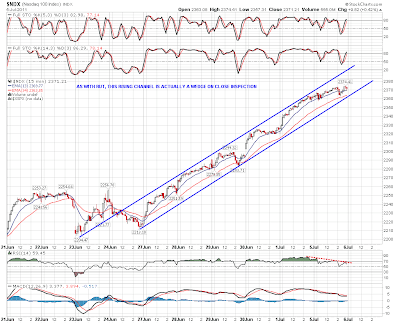
On NDX the rising channel is actually a slowly narrowing rising wedge, though in practical terms I would regard it as a channel. NDX has been the strongest of the three indices and is not yet testing channel support:
On RUT the rising channel is again a slowly narrowing rising wedge, though as with NDX I would treat it as a channel, as a rising wedge this hesitant rarely seems to play out to target on a break down. RUT was testing rising support on this channel yesterday:

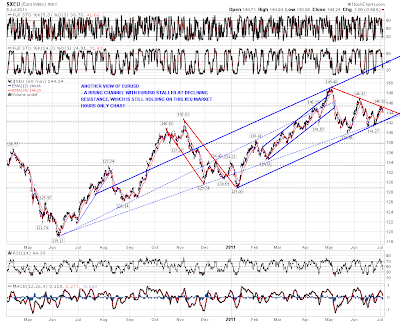
EURUSD is already correcting. You can see from this (market hours) XEU chart that it is failing at declining resistance, though that has broken on the 24hr forex charts and I'm not expecting that to hold as resistance. What is interesting on this XEU chart though is that EURUSD may be in a large rising channel that could carry it into the 1.55 area on a break up. Something to watch if that declining resistance breaks during market hours on the next move up:
Silver has been testing the broken support trendline and broken back up over it briefly overnight on the futures chart. It has reached my secondary declining channel target and reversed there for the moment. Seasonality favors more correction/consolidation for silver for the next few weeks. The picture looks similar on the SLV daily chart and I'm leaning short on SLV for the next few days:

Oil futures broke back and closed above my bull / bear line at 96.2 yesterday. It's back below there again now but oil now looks a much more dangerous short:

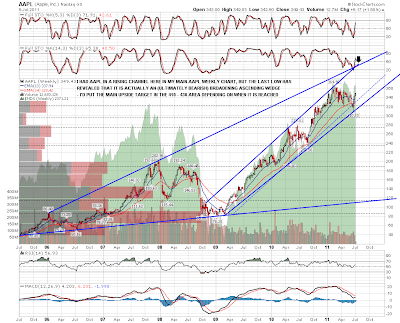
The last chart for today is my AAPL weekly chart, where I've been wondering for a year or more whether this chart is a proxy view for the likely duration and extent of the current bull market. I had AAPL in a rising channel with an unproven lower trendline, and it broke that channel support trendline on the last move down. However the low delivered a much better looking support trendline with three touches that has now turned the current pattern into an (ultimately bearish) broadening ascending wedge. The really interesting thing about this chart though is the longer term resistance trendline that would see AAPL peaking in the 410-30 area (depending on when it is reached) at the end of this third wave up. Definitely something that I will be watching, and if we see new highs on the equity indices then I'll be watching it very closely:
We might well see some retracement on equities today. On ES the key level that needs to break to deliver that retracement is 1330 on an hourly close below it. My expectations for any retracement are modest unless EURUSD can break 1.43 with confidence, and I'll be watching the daily 50 SMA on SPX at 1317.29 as my preferred support level for that retracement. If that is broken I'd be looking for support in the 1300 SPX area and would be very surprised to see that broken with confidence in the next few days.
