
Not a lot happened yesterday, but the marginal new intraday high on NDX was enough to penetrate the resistance trendline of the broadening top on NDX that I posted yesterday morning. That's a small break and wasn't held into the close, but it looks significant, and the bull case here feels somewhat more weighty as a result this morning:

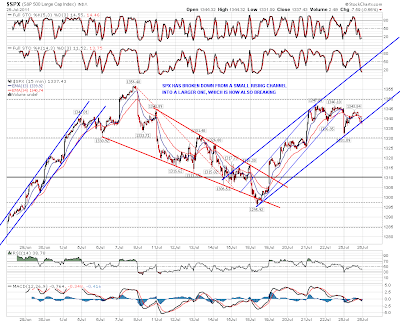
Short term here though, the trendlines on the 15min index charts look bearish to me. SPX has broken down from the rising channel I posted on Friday into a larger rising channel which is now also breaking down:
Dow has also broken down from the rising channel I posted on Friday morning into a larger rising channel. Support on that larger channel was being tested at the close yesterday:

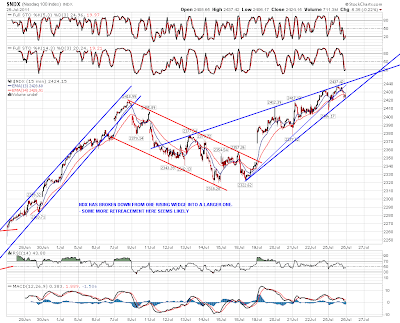
NDX has broken down from the rising wedge I posted yesterday into a larger rising wedge, and is testing that new support trendline:
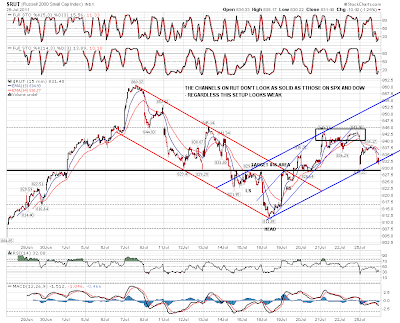
The trendlines all look pretty clear on the three charts above but they're fuzzier on RUT. RUT looks the weakest of the three however with an nice little double top on negative divergence:
So what of the longer term situation here? Can a major new bull wave be in progress. My bullish EW friend Pug thinks so, and taking the other end of his trades has been an expensive business the last couple of years. He has us in wave 2 of major P3 here, with 3 pf P3 starting after a retracement to 1327 SPX to 1315 SPX. Considering the likely reaction to an announcement of a debt deal here, which if it will be made at all should be made by next Monday, it isn't at all hard to see a powerful reaction move to new highs in response, which would deliver Pug's third wave move through overhead resistance.
On the bear side I understand there's an important Bradley turn date on Friday and as Cobra points out in last night's post, QQQ is showing some characteristic topping candles.
One of the most important things to see in a new bull wave up would be a significant new decline on USD, and I posted the chart on Friday showing the break down from the short term triangle. That break down has been sustained and consolidated since, and the triangle target would be near main declining support for USD in the 71 area. If we see that then that should certainly give equities a significant boost:

We're in limbo this week while the debt ceiling deal in being negotiated in the US. It's hard to see a big move up before there's serious progress there. Leaning short for some correction in the next day or two.
