Slope of Hope Blog Posts

Slope initially began as a blog, so this is where most of the website’s content resides. Here we have tens of thousands of posts dating back over a decade. These are listed in reverse chronological order. Click on any category icon below to see posts tagged with that particular subject, or click on a word in the category cloud on the right side of the screen for more specific choices.

ST Targets Made (by Springheel Jack)

By -

Most of my upside targets from earlier in the week have now been made, so what now? Well I note that having stalled at 1343 resistance for much of the afternoon yesterday, ES broke up through it after hours and has traded with it as support overnight. It may well go higher today though I think we may well be close to a short term reversal. Fortunately some decent support trendlines have formed on the indices on the way up so I'll be watching those for a break. Here's the not quite perfect rising channel on SPX:

Dow has formed a gently narrowing rising wedge, though when a wedge looks this much like a rising channel, I tend to treat it as a rising channel and not a wedge. Dow is stalling at the July highs:

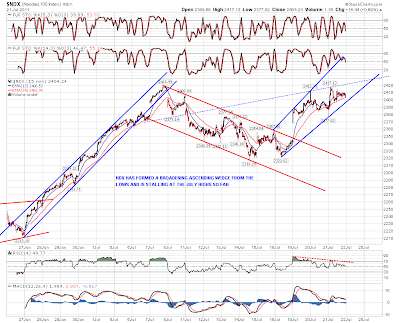
NDX has formed a broadening ascending wedge and like Dow, is stalling just under the July high:

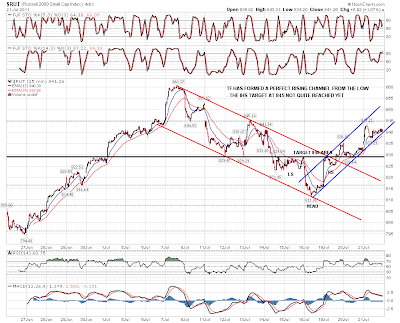
RUT has been by far the weakest of these four equity indices on the way up, which is a concern for anyone looking at the health and breadth of this move. It has also formed a rising channel on the move up and has not yet reached my target at 845. It is a long way short of the July high still:

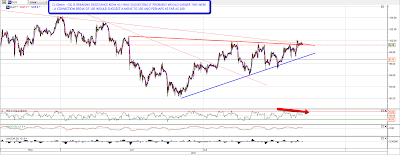
What do I think of this bull move? Well there are a lot of people that think that a big new bull wave up has started, and they could be right. I'll need some more evidence before I agree, but one big argument in the bears' favor was damaged yesterday, with the break down on USD. USD is still in the last stages of a huge bullish falling wedge, but the break down yesterday through the shorter term triangle at the end augurs badly for USD in the short term here, and opens the path to a significant move further down, and possibly even a new low. :

My friend strawberryblonde was saying yesterday that most stocks she was looking at were forming IHS-like or cup with handle-like formations, and the same is true of the indices of course. These aren't quite what we saw at the 2009  or 2010 lows though, the ones on NDX that Tim Knight posted yesterday and SPX which I'm posted below are continuation IHSes if anything, following earlier continuation IHSes that broke up and then failed. Will these fare better? Perhaps, but these aren't strong patterns:

I posted the oil charts a couple of days ago and was suggesting that a triangle breakout looked imminent. It retraced just afterwards but has now broken triangle resistance. On a conviction break of 100 I'm looking for 105, possibly 108, and if those levels can be held, possibly higher:

I'm looking for a short term high to be made soon and am watching the support trendlines on the top four charts for a reversal signal. I have an open mind over what happens afterwards and will be watching the depth and speed of the subsequent retracement for an indication of how far this summer rally might go.

A Bearish Speculative Options Bet

By -

In previous posts, I've mentioned a few guidelines I'd been keeping in mind when making speculative options buys (the first three of which are mentioned in Tim's book, Chart Your Way to Profits):

  • + Start small (since options often expire worthless).
  • + Avoid out-of-the-money-options (instead, try to get ones with some intrinsic value).
  • + Avoid nearby expiration dates (to avoid theta burn and give positions more time to work out).
  • + Buy options at a discount to model estimates of their fair market value.

I'd been making occasional bullish and bearish bets to increase the chances that some bets will make money whatever direction the market takes over the next several months, but held off when the VIX was over 20. With the VIX closing at 17.56 Thursday, I screened for some bets and placed a small limit order on one. More on that below, but first, a recap of my M.O. here, and a reminder about the difference between speculative options buying and hedging.

Looking for Speculative Options Bets

For the bearish bets, I’ve been starting by scanning for relatively lightly-traded (average daily volume over the last month of < 200k shares), optionable stocks that look weak technically and fundamentally. The idea behind looking for relatively thinly-traded stocks is that the options traded on them are more likely to be thinly-traded, which increases the chances that they might be inefficiently priced. Then I look for in-the-money puts on them several months out, and compare the current bid-ask prices for them with the estimated fair market value of them via the Black-Scholes model.

If I find one where the most recent bid is significantly below the Black-Scholes fair market value estimate, I’ll place a small limit order for it, with the limit price set at a ~20%+ discount to the fair market value estimate.

For the bullish bets, I’ve been doing the reverse: Scanning for stocks that look strong technically and fundamentally, and looking for in-the-money calls priced below the Black-Scholes estimates of their fair market value.

Examples

Prior to Thursday, I used this method to purchase puts on The St. Joe Company (JOE), Northern Dynasty Minerals, Ltd. (NAK), Motricity, Inc. (MOTR), Neutral Tandem Inc. (TNDM), Midas Group, Inc. (MDS), BioCryst Pharmaceuticals (BCRX), Omeros Corporation (OMER), Citi Trends, Inc. (CTRN); and calls on Honda Motor Co Ltd. (HMC), Hitachi, Ltd. (HIT), Coherent, Inc. (COHR), IXYS Corporation (IXYS), II-VI Incorporated (IIVI), ASM International N.V. (ASMI) and Superior Industries, International, Inc. (SUP). I noted these purchases (and sales, in the case of the ones I've exited already — NAK, MOTR, HMC and HIT) at the time on the Short Screen message boards.

Hedging vs. Betting

If I were hedging, I would enter the symbol of the stock or ETF I was looking to hedge in the “symbol” field of Portfolio Armor (available as a web app and as an Apple iOS app), enter the number of shares in the “shares owned” field, and then enter the maximum decline I was willing to risk in the “threshold” field. Then Portfolio Armor would use its algorithm to scan for the optimal puts to give me that level of protection at the lowest cost.

On rare occasions (I’ve seen it happen once, so far) the optimal puts Portfolio Armor presents might be in-the-money; in most cases however they will be out-of-the-money. Since I’m making a directional bet in the cases below, though, and not hedging, I bought slightly in-the-money options. This makes sense for directional bets (when you are willing to pay more to reduce the odds against your bet) but would be sub-optimal in most cases for hedging (when you want to get a certain level of protection at the lowest possible cost). There's a step by step example of that in this article.

A Bearish Bet

School Specialty, Inc.(SCHS) is provides supplemental educational products and equipment for the pre-kindergarten to twelfth grade market in the United States and Canada.

SCHS

Short Screen shows an Altman Z"-Score of -2.19 for SCHS (recall that scores of 1.1 and lower indicate financial distress, according to the model).

SCHS closed at $12.81 Thursday. At that price, the estimated fair market value of its $15 strike, February 2012 puts, according to the Black-Scholes model, was $3.72. The bid-ask on those puts was $2.65-$3.50. I put in a limit order for them at $2.95.

Pick of the Day – MON (by TraderHR)

By -

Monsanto Co. (MON), after breaking above its descending trend line and reaching the 74 area in late June, has been consolidating in the last two weeks in a bullish flag formation. This flag was broken today as the stock jumped toward the highs for the year, thus suggesting a new up-wave has started.

If MON breaks its 52-week high at 76.69 in the coming days, we could see the stock reach the 78-79 range next. Preferred entry (buy stop) price is at 76.80, with a stop at 74.30.

Mon
Originally published on TraderHR.com.