Slope of Hope Blog Posts

Slope initially began as a blog, so this is where most of the website’s content resides. Here we have tens of thousands of posts dating back over a decade. These are listed in reverse chronological order. Click on any category icon below to see posts tagged with that particular subject, or click on a word in the category cloud on the right side of the screen for more specific choices.

Floating Above the World (by Springheel Jack)

By -

Many technical analysts, including myself, work and trade in a world of trendlines, moving averages and indicators that is sufficiently divorced from the day to day world that we mostly ignore the news, on the assumption that the news will show up in the TA beforehand more often than not. Is that happening in this particularly news-dominated week? Perhaps, but if so then the TA is increasingly suggesting the news is not going to be that great. 

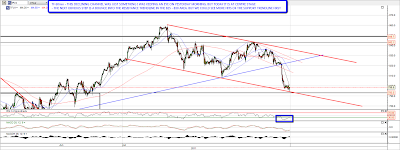
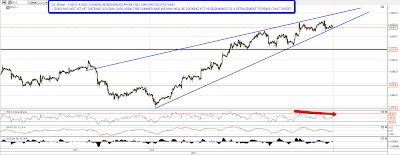
Front and center this morning is the TF declining channel that I posted yesterday, mentioning that we could see a move into the 795 area on a break of the rising support trendline in blue. TF has bottomed overnight at 794.3,which was a perfect channel support hit. All the equity indices are looking oversold on the 60min on this move down and I'm expecting a bounce here with an upside target on TF in the 820-30 area:

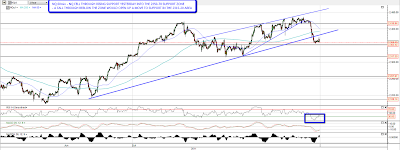
NQ has fallen into the 2350-70 support zone. a break below would most likely see NQ drop to the 2315-20 area:

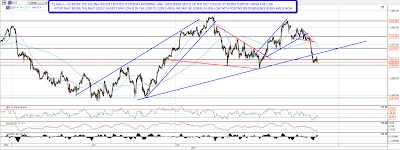
ES broke the falling wedge I posted yesterday while I was writing my morning post. The target at 1309 was made and ES bounced at rising support just under there for much of the day before giving it up in the last part of the session. If we're going to see a bounce near here, I have a support level near the overnight low at 1295.5, and there's a zone with quite a bit of support running down into the 1290 area:

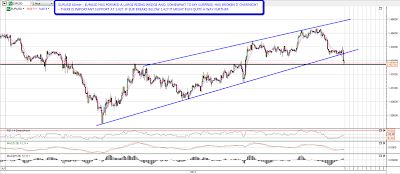
A key chart at the moment is obviously the EURUSD chart and I was going to post the rising wedge on that to support the case for a bounce here. Somewhat to my surprise however it has broken down from the wedge and is now testing strong support at 1.427. A break with confidence down through 1.427 could lead to a serious further slide in EURUSD in the short term and I'm watching that carefully:

Oil was trying to break resistance at 100 and that seemed likely. It turned back down yesterday and another move to test strong support at 95 looks likely. Another trader was remarking to me yesterday that failed breakouts often precede strong moves in the other direction, and that's some thing I'm bearing in mind here for oil, and indeed for NQ and EURUSD this morning, as both of those have also had breaks up that currently appear to be failing. Here's the oil chart:

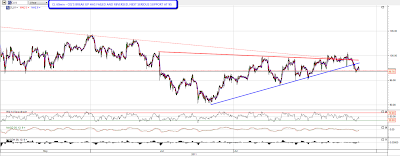
Gold is looking very interesting here. You can see from my gold futures chart that it has formed a decent quality rising wedge from the low at the beginning of July. Negative divergence on RSI is suggesting that this may well break down soon and I've mentioned before that I'd expected gold to hit the daily 150 SMA (1450 area) this summer. If it does so now then we could see a very nice move down on gold after a break of this rising wedge:

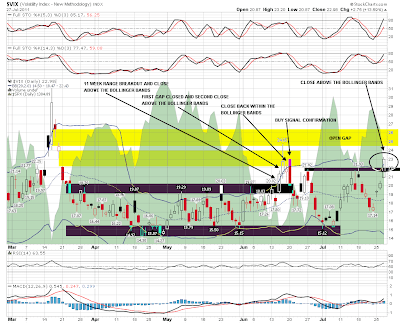
The last chart for today is the Vix daily chart, where there was a close above the bollinger bands yesterday. I've left the annotations for the last Vix Buy (equities) Signal on the chart and I'll be monitoring this daily. If we see another move up on Vix then there is an unfilled gap just over 26 and I've marked that on the chart:

I am leaning long for a bounce here today, but that's mainly based on the TF declining channel. If that channel breaks down then we could see a serious further slide across the board. A lot of technical damage was done yesterday and I'm expecting further downside after a bounce.

Costs of Hedging Treasury Bond Exposure Still Low, but Rising

By -

The chances of a debt ceiling deal

The Intrade prediction market enables participants to bet on whether Congress will approve an increase in the U.S. debt ceiling to $15.1 trillion on or before three dates: July 31st, August 31st, and September 30th. As of Tuesday evening, these were the chances of debt ceiling deals by those respective dates:

  • July 31st: 16.2% chance of a deal raising the debt ceiling to $15.1 trillion
  • August 31st: 75% chance of raising the debt ceiling by that much
  • September 30th: an 88.9% chance of raising the debt ceiling by that much

Unfortunately, Intrade doesn't offer a market for betting on whether a debt ceiling deal will be reached by August 2nd, the putative deadline.

Breaching the debt ceiling need not lead to an imminent default

If Congress can't come to a deal raising the debt ceiling in time, the U.S. government will not be able to borrow to pay all of its obligations, but that doesn't mean this will necessarily lead to an imminent default. The government could instead prioritize payments so that holders of Treasury securities get their interest payments as scheduled, while withholding payment from other parties (e.g., by furloughing some Federal workers, or by delaying some transfer payments).

Nevertheless, a failure of Congress to reach agreement on raising the debt ceiling would be inauspicious for holders of Treasury bonds. Another point to consider is that, even if a debt ceiling deal is reached, U.S. debt may still be downgraded at some point, which could lead to forced selling by funds which are required to own only AAA-rated bonds.

Hedging against a failure to raise the debt ceiling

In a post elsewhere earlier this month ("Helping House Majority Leader Hedge His Treasuries Exposure"), we noted reports that the House Majority Leader held "up to $15,000 in shares of the 2x levered ProShares Trust Ultrashort 20+ Year Treasury ETF (TBT)", an amount, we suggested, was probably too low to provide much of a hedge for his exposure to Treasuries.

A more precise way to hedge

As we mentioned in a previous post, precision is one of the advantages of using optimal puts, rather than inverse ETFs, to hedge:

  • Precision. Say you own 824 shares of Exxon Mobil, and you'd like to know how to hedge that position against a greater-than-17% loss. Using Portfolio Armor (available as a web app and as an Apple iOS app), you could simply enter "XOM" in the symbol field, "824" in the number of shares field, and "17%" in the threshold field, and then Portfolio Armor would use its algorithm to scan for the optimal puts to give you that level of protection at the lowest cost.1

The example above mentions a stock, but as we noted in that post earlier this month, Rep. Cantor could find optimal puts on the U.S. Treasury bond-tracking ETF, iShares Barclays 20+ Year Treasury Bond (TLT), as a proxy for his exposure to Treasury bonds, in the same way.

Hedging costs as of Friday's close

The table below shows the costs, as of last Friday's close, of hedging against greater-than-15% and -20% declines, respectively, in TLT until January 20th, 2012.

Symbol

Name

Decline Threshold

Cost as % of Position
TLT iShares Barclays 20+ Year Treasury Bond 15% 1.22%*

TLT

iShares Barclays 20+ Year Treasury Bond

20%

0.66%*

Hedging costs as of Tuesday's close

The table below shows the costs, as of Tuesday's close, of hedging greater-than-15% and -20% declines, respectively, in TLT until January 20th, 2012. Note that the costs are still relatively low, but have increased since Friday.

Symbol

Name

Decline Threshold

Cost as % of Position
TLT iShares Barclays 20+ Year Treasury Bond 15% 1.48%*

TLT

iShares Barclays 20+ Year Treasury Bond

20%

0.77%*

*Based on optimal puts expiring in January, 2012.

1In that case, Portfolio Armor would round down the number of shares you entered to the nearest hundred (since one put option contract represents the right to sell one hundred shares of the underlying security), and then present you with eight of the put option contracts that would slightly over-hedge the 800 shares they cover, so that the total value of your 824 shares would be protected against a greater-than-17% loss.