
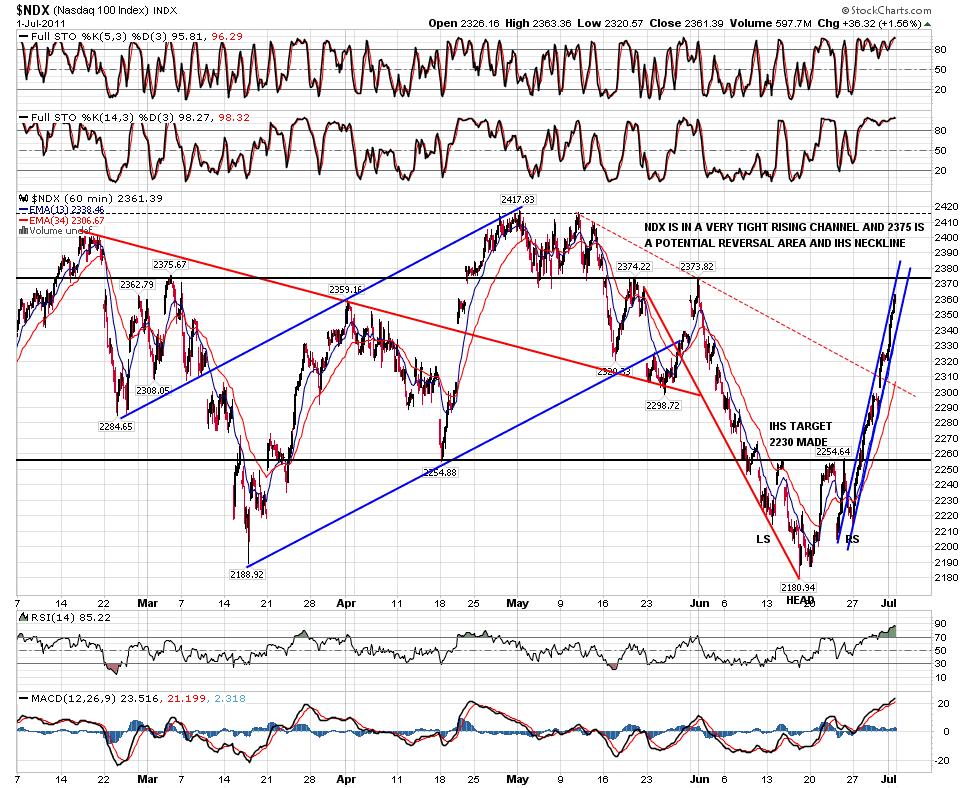
I'm having some problems with my main computer this morning, so this post will have to be short, and I'll only post charts for SPX, NDX, RUT and the Vix. Obviously that was an amazing week for the bulls last week, and the main equity indices punched through their daily bollinger bands and have stayed above them so far. Obviously these indices are all now very short term overbought and due for a retracement, but the stats for the second trading day of the month are fairly bullish and we may not see that today. Short term SPX, NDX and RUT are all in very narrow and steep rising channels and are approaching potential reversal areas that are all possible necklines for continuation IHS that could form here. I have that at 1344-5 on SPX at the Feb high:

On NDX the possible neckline area is at 2375:
On RUT the potential neckline area is at 848.30:

Vix reached the bottom of the daily bollinger bands and touched it on the last three days of last week. Vix has also now reached the support zone that marked lows in April and May:

Some notes on other things of interest. Silver is holding the broken support trendline so far though it is being tested a second time at the moment. EURUSD has broken declining resistance but has also broken the rising channel and appears to be making a short term top. This may just be a small retracement. Oil has broken declining resistance and is testing 96. A break of 96 with confidence would look pretty bullish.
It's still possible that the equity indices are forming the right shoulder on large H&S patterns, but the move last week was so strong that that now seems much more doubtful. The rise was so strong that the rising channels are incredibly narrow and no bear patterns have had a chance to form. The depth of the first retracement should tell us a lot when we see it, but at the moment the presumption here really has to be that we are going to see more upside, and that dips should be bought until demonstrated otherwise.
