
Yesterday was one of those slightly spooky days when everything I post in the morning delivers. The ES IHS and the silver trendline break delivered so well I've saved both as textbook models of how these should look. Today is going to be tougher, and tomorrow morning of course we have the complete wild card of Bernanke's speech at Jackson Hole, which could spark off a big rally in the event that he announces QE3, or spark off a big decline in the event that he just waffles about the underlying strength of the economy. What do the charts say? Well it's a mixed bag this morning.
The first thing to note is that not far above there are some important unfilled gaps on SPX, NDX and RUT. Here's how that looks on SPX, with the gap at 1193.80 and important resistance at 1185:

On NDX the gap is at 2181.62, and I have important resistance at 2160:

On RUT the gap is at 704.03, and I have important resistance at 698:

Will the gaps fill? Perhaps, but the overnight action on ES doesn't look that promising and Steve Jobs' resignation as CEO of Apple last night might drag down NDX particularly. On ES I've been watching for a break of the very decent quality channel support trendline on ES and saw that overnight. The trendline was then briefly recovered to test yesterday's high and then lost again. ES is in a consolidation rectangle and that might still break up, but the trendline break still looks weak, and the bulls might well get a very nasty surprise today if ES breaks down from that rectangle:

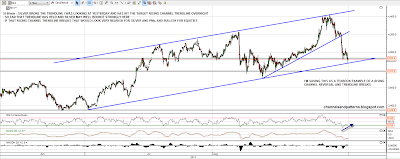
Silver has been a top performer this week, from a technical standpoint, and after the break down from the support trendline I highlighted yesterday morning made it precisely to my target channel support trendline at 3876 (on SI) overnight. This is the likely reversal area if silver is going to reverse back up and it has bounced there so far. I posted a chart on gold last night that you can see here showing support at 1725 (on GC) and gold went through it overnight to 1705. That wasn't bullish and you can see that there is also an unfilled gap on GC now much further below. Here's how the silver chart (SI) looks now:
Bonds fell hard too but are still well short of my support area and possible H&S neckline at 135. 135 would also be almost exactly at the 38.2% fib retracement of this last powerful wave up from late July. I still like 135 as my main target here, but ZB has consolidated overnight and is showing some positive divergence on the 60min RSI. It could bounce here today:

I have very mixed feelings about direction today and am watching the consolidation rectangle on ES for immediate direction. If it breaks up then I'll be looking for the gap fills on SPX, NDX and RUT. Even if that happens though there are now some real signs of weakness appearing and I'll be watching for reversal. If ZB (30yr Treasury futures) makes it to 35 I'll be looking for a reversal there. That might well happen if the gaps on the equity indices are filled. If silver breaks channel support then I'll be looking for another leg down on PMs which would most likely be bullish for equities. Copper and USD aren't moving much and so are giving little clue as to direction.
