
Hedging costs of Leading ETFs — in late June and now
Hey fellow Slopers,
In looking back at the hedging costs of the most widely-traded ETFs toward the end of June versus the same basket of ETFs on Tuesday, I figured they'd all be more expensive to hedge now. That turned out to be true of 9 out of 10 of them: the only one of those ETFs that is cheaper to hedge now is the iShares MSCI Japan Index (EWJ).
The two tables below show the costs of hedging EWJ and the other 9 ETFs against greater-than-20% declines over the next several months, using optimal puts, as of June 23rd (when the VIX S&P 500 volatility index was at 19.29), and as of October 18th (with the VIX at 31.56). First, a reminder about what optimal puts are, and why I've used 20% as a decline threshold; then, a screen capture showing the current optimal puts to hedge the one ETF with lower hedging costs now than in late June (EWJ).
About Optimal Puts
Optimal puts are the ones that will give you the level of protection you want at the lowest possible cost. Portfolio Armor uses an algorithm developed by a finance Ph.D. to sort through and analyze all of the available puts for your position, scanning for the optimal ones.
Decline Thresholds
In this context, "threshold" refers to the maximum decline you are willing to risk in the value of your position in a security. You can enter any percentage you like for a decline threshold when scanning for optimal puts (the higher the percentage though, the greater the chance you will find optimal puts for your position). I have used 20% thresholds for each of the securities below. Essentially, 20% is a large enough threshold that it reduces the cost of hedging, but not so large that it precludes a recovery.
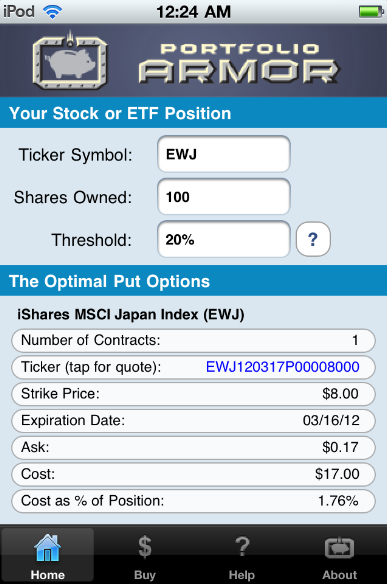
The Optimal Puts For EWJ
Below is a screen capture from the Portfolio Armor iOS app showing the optimal put option contract to buy to hedge 100 shares of EWJ against a greater-than-20% drop between now and March, 16, 2012. One note about these optimal put options and their cost: to be conservative, Portfolio Armor calculated the cost based on the ask price of the optimal puts. In practice an investor can often purchase puts for a lower price, i.e., some price between the bid and the ask.
Hedging Costs as of Thursday, June 23rd
The data in the table below are as of June 23rd. The ETFs are listed in order of their trading volume on June 23rd, with the most heavily-traded ETF (SPY) at the top.
|
Symbol |
Name |
Cost of Protection (as % of position value) |
|
SPY |
SPDR S&P 500 |
1.40%* |
| XLF | Financial Select Sector SPDR | 3.10%* |
|
IWM |
iShares Russell Index 2000 |
2.69%* |
| EEM | iShares MSCI Emerging Markets | 2.59%* |
| XLE | Energy Select Sector SPDR | 2.24%* |
| USO | The United States Oil ETF, LP | 4.47%** |
| EWJ | iShares MSCI Japan Index | 2.58%* |
| XLI | Industrial Select Sector SPDR | 2.22%* |
| EFA | iShares MSCI EAFE Index | 3.07%* |
| XLV | Health Care Select SPDR | 1.14%* |
*Based on optimal puts expiring in December, 2011
*Based on optimal puts expiring in January, 2012
Hedging Costs as of Tuesday, October 18th
The data in the table below are as of Tuesday, October 18th. For comparison purposes, the ETFs are listed in the same order as in the table above.
|
Symbol |
Name |
Cost of Protection (as % of position value) |
|
SPY |
SPDR S&P 500 |
2.62%* |
| XLF | Financial Select Sector SPDR | 5.39%* |
|
IWM |
iShares Russell Index 2000 |
6.61%*** |
| EEM | iShares MSCI Emerging Markets | 11.8%* |
| XLE | Energy Select Sector SPDR | 4.19%* |
| USO | The United States Oil ETF, LP | 7.06%** |
| EWJ | iShares MSCI Japan Index | 1.76%* |
| XLI | Industrial Select Sector SPDR | 3.48%* |
| EFA | iShares MSCI EAFE Index | 4.16%* |
| XLV | Health Care Select SPDR | 2.06%* |
*Based on optimal puts expiring in March, 2012
**Based on optimal puts expiring in April, 2012
***Based on optimal puts expiring in May, 2012
