
I've been reading a lot that the direction in which the symmetrical triangles break should be respected, and that's true up to a point, though in my experience these triangles have a nasty habit of overshooting on the last wave and then playing out in the opposite direction, and that's worth bearing in mind.
Until they break the market is in limbo, though I'll pass the time while we're waiting with a few observations further down on the relationship between equities and USD.
First the equity charts, which look much the same as yesterday. Support and resistance on the ES and TF triangles have moved slightly of course and on ES they are now in the 1230 and 1266 areas respectively:
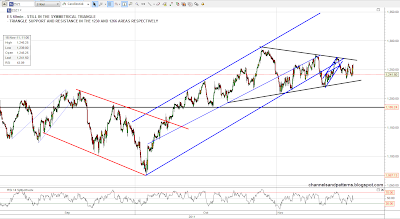
On TF triangle support and resistance are now in the 713 and 745 areas respectively:
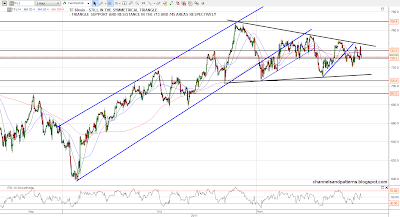
On NQ we may now have a small rising channel in play within the overall consolidation range. Channel support and resistance are in the 2320 and 2380 areas respectively and the 60min RSI was showing negative divergence at the high yesterday, suggesting that we might see a move lower today towards 2320:

Oil is still holding the rising channel, and I've marked a small rising channel within that channel to show the tightness of the recent moves up. This hugging of the overall rising channel suggests that we might see a break down soon and oil is clearly struggling to break over resistance at 100:

I haven't posted a silver chart in a while, and that's still within the overall declining channel that I posted at the September lows. There's a possible rising wedge forming but the main things to watch are the strong support trendline for the current move, which needs to remain unbroken for the uptrend to continue, and the small declining resistance trendline from the last high, which needs to be broken soon on the same basis:

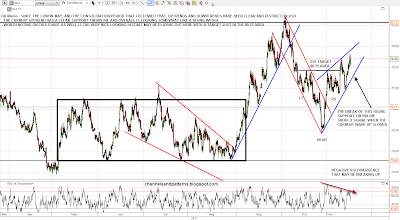
The main thing I wanted to look at today though was USD, and I've charted that up on the DX chart, which is looking interesting and fairly strongly bullish. I've marked up the IHS there, which has been somewhat weakened by DX moving back under the neckline after it broke up, but the main thing to note is the decent rising support trendline, which should give a clear signal when the current move wave up breaks down. There's also a possible rising wedge forming on the chart.
Something I've noted in the past is that while waves up and down on USD sometimes decouple, and sometimes can decouple for quite a while, as we saw in the November 2009 to April 2010 period for instance, there is still some correlation remaining. When equities and USD are both in uptrends as they were then, and very possibly are now, there was a characteristic way in which they would move during the short term waves up and down on USD.
What I was seeing and posting about then in early 2010, was the way in which during waves down on USD, within the larger uptrend, equities would move upwards very strongly, and then while USD was retracing, equities would trade sideways. How does that compare to what we are seeing now? Well USD retraced strongly from a high in early October to a low in late October, and while that happened equities moved up very strongly. USD then made a retracement low in late October and started another strong move up, since when equities have traded sideways, forming the symmetrical triangles or pennants that we are seeing form at the moment. That is suggesting to me that as and when this current wave up on USD finishes, we may well see another strong move up on equities as it then retraces. Hard to say when this wave up on USD might end of course, but I'll be watching that support trendline:
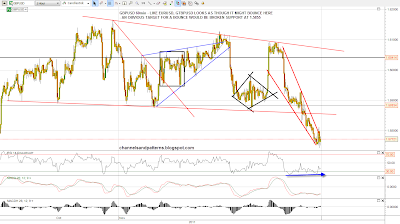
Short term the obvious next move on DX is a bit higher to touch the upper trendline on what may be a rising wedge forming, and I'd like to see that happen to confirm the rising wedge, or to break higher and possibly form a rising channel. EURUSD and GBPUSD are both consolidating and trying to bounce a bit with some positive divergence on the 60min RSI though, and we might therefore see USD retrace a bit sooner. Here's how that looks on GBPUSD:
Meanwhile we are just moving sideways on equities within the triangles, and it's hard to say what might happen today. I'd like to see a move up on USD with equities moving down to touch the lower trendlines of the triangles on ES and TF. We'll see how that goes.
