
ES has been consolidating for a few days without any hits of the two trendlines that I have been mentioning every day. That has changed overnight with declining resistance from July hit at the overnight high, and then rising support from the last low broken on the next swing down. If we are going to see some retracement on equities then this is the place, though we might see a bit more chopping about before it really gets going:

On the SPX daily chart we've been seeing repeated tests of the daily 200 SMA. This is a key bull/bear dividing line and an obvious point of potential failure:

There is a very nice bounce setup on the Vix, with a bounce at rising support on positive RSI divergence, a break of short term declining resistance, and an open gap invitingly just above:

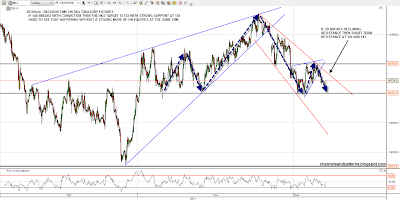
None of this means that we are going to see a decent retracement of course, but the setup now looks very promising. If it goes the other way then we might see a big move up. You can see the potential for that best on the 30yr Treasury futures (ZB) chart, where a reversal H&S is now fully formed and waiting for a neckline break. If we see that break then I'd expect a very significant move down on ZB and I'd expect to see a corresponding move up on equities:
Last chart of the day is EWZ, the Brazil ETF. You can see the rising channel from the low and the sloping IHS forming there. If that IHS breaks up the target would be a retest of the April highs. Food for thought though it is still some way short of the neckline:

How far might any retracement go? Hard to say, but I'll be watching the significant support levels in the 1240, 1230 and 1220 areas. Much below those and this will start to look more interesting, with the next big support levels in the 1200 and 1180-5 areas. Either way this is an important inflection point here. Are the bears ready to take advantage of this nice reversal setup or are they now too neutered to do more than watch? Either way I'm expecting the break we see after this lengthy consolidation to be significant.
