
I'll do a quick extra post today as I've been having a look at XLF this morning, and there is a very important resistance test coming up shortly if XLF rallies much further. That's best seen on the daily 6yr chart and you can see that XLF hit declining resistance from the 2007 high in April this year, and has been sliding down that trendline with multiple tests ever since:

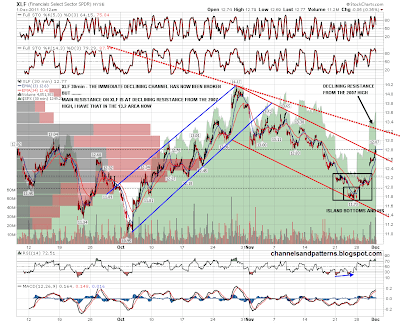
Short term XLF has put in a solid low and broken the declining channel from the October high. Main declining resistance from 2007 is in the 13.2 2 to 13.3 area now. Will XLF break up through it? Who can say? If XLF does break over that declining resistance trendline though that will look very significant, and the resistance break might have serious implications for the wider market:
We shall see. Personally I wouldn't take the view that XLF breaking up would confirm a new cyclical bull market, but I would say that in the absence of XLF breaking up through that declining resistance, any sustained move up on equities here will look doomed to fail soon.
