
The short term rising channel on SPX and ES broke down with conviction on Friday morning but after the early low we saw the usual reversal and grind up for the rest of the day. Overnight ES has made a new high so the short term topping setup has been negated. I've been mentioning every couple of days that declining resistance from the 2011 high is in the 1315-20 area, and that for me is the obvious upside target here. I've marked the key resistance and support trendlines on the SPX 60min chart. A break above declining resistance from the 2011 high would need to be confirmed with a break above declining resistance from the 2007 high through the 2011 high, and that's a few points higher. If we see that then I'll be using a new bull market as my primary scenario. A break below rising support from the October low, currently in the 1235-40 area, would most likely confirm that we are still in a bear market:

There are a number of key bear market indicators that I watch and post, and the last really big one is worth having a look at today. That indicator is the crosses of the 13 & 34 weekly EMAs on SPX. It's worth noting that during the last two bear markets the two EMAs did not touch again until the bear market had ended, so it's cautiously bullish that they are now crossing again. If we see a cross with conviction then it will be likely that we are looking at a new bull market and I wouldn't expect another cross with conviction until after the start of the next bear market:

Does this mean that I think we are in a new bull market? No, but it is a possibility that is growing stronger as SPX trends higher despite the negative divergences from what would normally be leading that bull market. Oner of those is copper and while it is still strongly negatively divergent against SPX it has broken up from the triangle of the last few weeks. It is testing the triangle top now (October high), the next resistance above is at the 2011 double-top base in the 390 area and I make the triangle target in the 425 area:

Looking at the Vix the first resistance at the middle bollinger bands on the daily chart was hit on Friday. That's an obvious area from which to see another swing down:

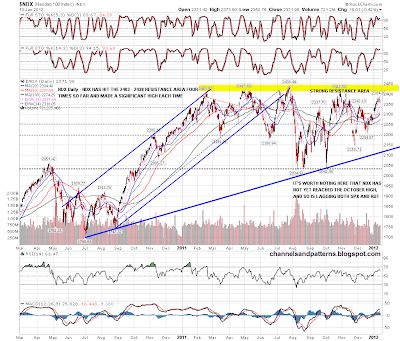
We are reaching a key resistance area on NDX as well and I've marked that up on the daily chart. The 2403-38 area has had four hits in the last year and each marked a swing high followed by a reversal at least 9%. This is the obvious area to look for a big reversal on NDX this time as well. It's worth noting that NDX has not yet reached the October high, and so has been lagging both SPX and RUT since then:
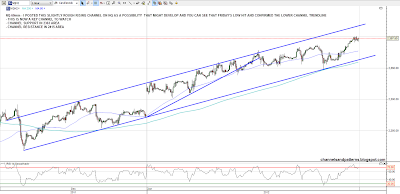
On NQ I posted a possible channel that might form a few days ago and Friday's low confirmed the lower trendline. This is a key channel to watch now, though it is a little rough. Unlike on SPX or ES however it gives us a valid support trendline from the last low, which is a stronger trendline setup:
We are coming into both a decent time area for a big reversal and natural resistance areas for a swing high. It's natural to feel that the trend will continue after any significant move but it's worth remembering that we are still in an area where which is consistent with an ongoing bear market. Just to illustrate that point I'll include here an email I sent on 25th November, near the 1158 low then, saying that I was expecting a reversal up that might last in fits and starts until mid to late January. We're in that time area now and there has not yet been a break of declining resistance from the 2011 highs. We've had some positive economic data since then but the scenario that I was outlining afterwards for 2012 is still perfectly valid. This is not an area to fall in love with the bull side as yet:

Short term I'm expecting a partial gap fill towards rising support from Friday's low, and that's in the 1295 area. Any lower and the gap from Friday's close may fill.
