
My post will be a bit different today. As I have mentioned frequently, the current move up from the December low on SPX hasn't delivered much in the way of decent overall trendlines, so I'm going to present the consensus view from the EWers, who have had an impressively good handle on the current move up. You'll have to excuse my amateurish EW labelling and chart, but while I always keep an eye on the EW view, it isn't my thing really, and I rarely mark up an EW count on a chart.
I know that elliot wave counts are anathema to a lot of my readers, but like any form of analysis you get the best results from the best practitioners and I have a lot of confidence is the ones I follow. The shallow retracements on trendline breaks that we have seen on the current move up from the mid December low are also strongly characteristic of wave 3 moves I've seen in the past, so the overall thesis is reasonable, though I don't much care for the idea that SPX is going to rise much higher, as that seriously weakens the case that we are still in a bear market:
Broadly speaking the move up from the October low was a five wave move up for wave 1 or A, and the move down into the November low was an ABC correction. We are currently in wave 3 or C, and at the end of this move up, the key dividing line for whether this is a new bull market or a bear market continuation is whether the major wave that follows breaches the October high, as a wave 4 should never cross back into wave 1 of the same degree. In the current wave 3 or C up, the consensus view seems to be that we are now in wave v up, and as I've shown on the 30min SPX chart below, that is supported by the short term support trendlines that I have also marked on the chart. Where will subwave v of 3 end? The 1320 area is a popular choice though obviously it might go higher. I've also marked in the obvious target for the wave 4 that should start soon, and that is at rising support from the November low:

The next chart has no count on it, but shows the support trendline for the current wave v of 3 move up on the SPX 15min chart. I've mentioned that the support trendline from the November low is in the 1260 area and rising at about 14 points per week. One this to add to that is that the wave 1 high for the current wave 3 was at 1267 SPX, so that should hold any retracement unless this count is wrong. If the count is right then after the wave 4 that should be coming soon, we would start a wave 5 up that should exceed the wave 3 highs:

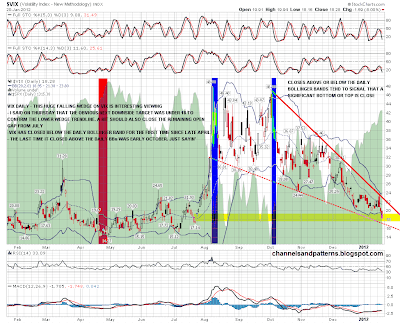
In terms of the bigger picture the Vix closed below the daily bollinger bands on Friday, which is a strong signal that we are in the process of making a significant interim top. How close might that be? A look at the last Vix close below the daily BBs in April is instructive, as it was followed by a last move up, with the Vix making a higher low. From a trendline perspective Vix is now close to the support trendline of a possible falling wedge and if it hits it, that would also fill an open gap from July. Open gaps on Vix have a tendency to fill so I'm expecting this one to fill shortly:
EURUSD broke the short term support trendline from the low, but then broke back up. I've marked in a four touch resistance trendline that I thought might hold but that has now broken too. The obvious target for this move was and still is the strong resistance level and possible IHS neckline in the 1.308 area:

ZB failed to reverse on Friday, and has broken support in the 142 area. The obvious next target is the November and December lows in the139'25 area, and that level is a possible H&S neckline, which is a concern for equity bears here. I'm pressed for space today so I won't show that chart and I'll show the CL chart instead. I suggested on Wednesday morning that the obvious next move on CL was a test of broken support in the 102.10 area, followed by a return to the 98 area to complete a potential H&S. CL peaked shortly after my post at 102.06 and has now completed that H&S. If it breaks downwards the target would be a test of the December low in the 92.70 area. A lot of H&S patterns fail at the neckline though so we'll see:

I've been having a look at gold and silver over the weekend after the very impressive break up by silver on Friday. Looking at the gold chart first there is a test coming very shortly of double resistance, which is at declining resistance from the 2011 high, and a test of the broken 150 DMA, which was support from early 2009. Until those break I'm leaning short on gold from that test. If gold breaks up then a major swing low may well be in on gold, and the next resistance would be a test of broken support from early 2011 slightly over 1700. A break there would suggest a test of the 2011 highs:

The silver chart has to be read in the context of the gold chart, as broadly speaking they tend to trend together. Short term the next resistance is a test of the 100 DMA in the 33.2 area, and on a break above I'd be seeing further resistance at 35.70, and a possible test of declining (channel) resistance from the 2011 highs in the 38 area:

I'm leaning bullish today unless the short term support trendline on my SPX 15min chart is breached. That support is currently in the 1312 SPX area. If it is breached then I'll be expecting a short term high to be in, and would be looking for a retracement towards rising support from the November low in the 1270-80 area. On a break below 1269 SPX a major interim top might well be in.
