
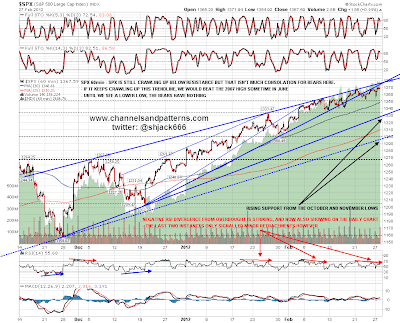
The dip buyers had yet another great day yesterday as the large opening gap down was swiftly converted into a new high on SPX since the March 2009 low. That new high isn't a break with confidence of very strong 1370 area resistance yet, but if it does break with confidence then that opens up targets in the 1400 to 1440 area as you can see on the 6yr daily chart. My preferred trendline target would then be possible channel resistance in the 1410-20 area, with my reserve target being the 2008 high at 1440.24.
There is one other thing well worth noting from the chart below. Major tops on SPX are generally preceded by a sizable counter-trend spike that sets up either a head and shoulders pattern, or a double-top or bottom. We have seen no such counter-trend spike for quite a while now, and it's unlikely that we would see a major top without one. That counter-trend spike would generally precede the high for the year by a couple of months:

On the 60min chart we are still crawling up the strong resistance trendline on SPX. Of itself that isn't actually a signal to short of course. That trendline has risen 145 points in the last eleven weeks, and if SPX continued to crawl up it then it would move above the 2007 high on SPX sometime in June or early July. What I have been watching as a possible reversal indicator is the support trendline from the Dec 19th low, but I'll generally disregard a trendline like this once it crosses the main resistance trendline, which it will do over the next day or two. Once that happens then the only really decent support trendline to watch on SPX here will be gone:
In the very short term the rising support break and negative RSI divergence on the ES 15min chart are suggesting a dip in the near future. This isn't an infallible guide, but it's been performing fairly well as you can see from the chart. Obviously this setup also looks rather bull flaggish however, so I'd like to see a break below 1368.50 support on ES to confirm:

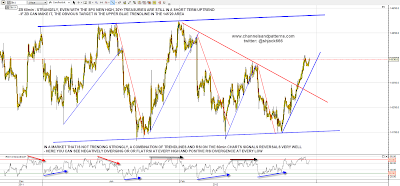
30yr Treasury futures (ZB) and equities have diverged more than usual recently, and at the moment ZB is in a short term uptrend with SPX. I've drawn in the trendlines and RSI divergences to illustrate how well these work in a market which isn't trending strongly. The short term uptrend on ZB looks solid and I have a possible upside trendline target in the 145'20 area, though it's a little hard to see it getting there without at least a little weakness on equities:
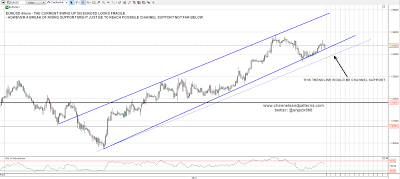
As I said yesterday, EURUSD is still some way below my rally targets at the moment, but the short term uptrend there is looking a little tired and we might see some weakness there:
Lastly today I wanted to spend some time looking at the current Dow Theory divergence between the Dow and Transports indices. For those of you who aren't familiar with Dow Theory (DT) I'll recap it very quickly by saying that it is one of the oldest schools of TA, that it has been working well for over a century since being first developed by Charles Dow, one of the founders of the Wall Street Journal, and creator of the eponymous Dow Index. The theory behind it is essentially that in a strong uptrend or downtrend both indices need to confirm new highs or lows, and that when one index makes a new high or low that is not confirmed by the other, then it is a signal that a significant top or bottom may be close.
Here's the weekly Dow vs Transports chart over the last 15 years to illustrate that DT divergences are generally seen at most major highs and lows on the monthly chart, with March 2009 being a notable exception. The current divergence is very striking, with Dow over the 2011 highs and Transports still well below:
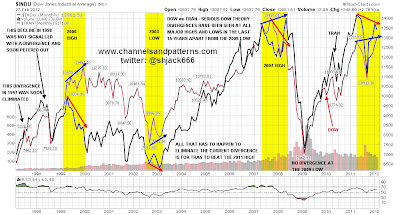
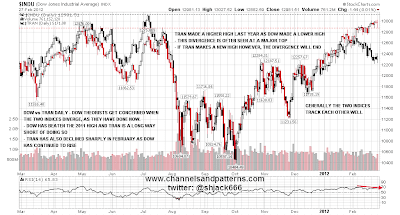
Looking at these indices on the one year daily chart, you can see that these indices generally track each other well. There was a new high on Transports in July 2011 that was not confirmed by the Dow and that preceded the waterfall last summer. There was no divergence at the October low, though these divergences do appear more reliably at highs than at lows. The current divergence is very striking, and comparable to that seen at the 2000 and 2007 highs.
What's worth bearing in mind however is that this DT divergence would be eliminated as soon as Transports beat the 2011 high, and that significant previous divergences in 2004 and 2010 lasted for months before confirmation. The divergence in 2004 lasted about six months before Dow confirmed with a new high at the end of that year. It is interesting though, and worth keeping an eye on. If SPX should fall below 1292 I would start paying this signal much more attention:
Short term I have strong trendline resistance on SPX in the 1377/8 area today, and with ES at 1373 as I write, that's obviously just above. That resistance trendline might break but it's a strong six-touch trendline that is in any case rising fairly steeply. The chances are it will hold, so I'm looking for some retracement here. Have I seen trendlines like this one break in strong uptrends before? Yes, so it does happen. There's a lot of information on the charts today that isn't in the writeup, so if you want to see that you'll need to click on the charts for the full size version.
