
Another day with no significant reversal on equities, and though upside progress in the last two weeks has been very limited on SPX, it is still crawling up the strong resistance trendline I have on the SPX 60min chart. SPX is now trading under the support trendline from the Dec 19th low and is showing increasing negative divergence on the daily RSI, but is showing little sign of actually retracing. In the event that SPX should hit my resistance trendline again, I see that in the 1372/3 area today, so we may see a test of the 2011 high shortly:

The picture across other indices looks mixed at best. On NQ the strong rising channel support trendline was pinocchioed yesterday morning, which was promising for retracement, but overnight NQ has broken and stayed above strong resistance at 2600, which is alarming, as I have channel resistance currently in the 2658 area:

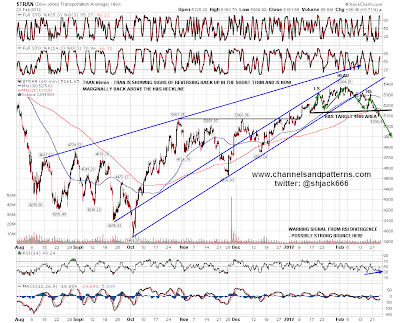
There's been little movement on the Transports index, but the positive RSI divergence I've been looking at there is still there, and TRAN is trading slightly above the broken H&S neckline. A stronger bounce there is still therefore in play:
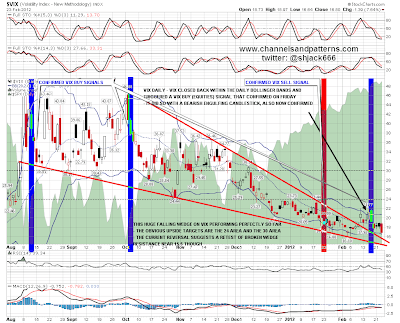
I was looking at the Vix Buy (equities) Signal and confirmed bearish engulfing candlestick there on Monday and the track record of Vix Signals is so mixed that I am inclined to disregard it. Bearish or bullish engulfing candlesticks are another matter however, and a confirmed one of these generally leads to at least some continuation. We were seeing that yesterday and Vix reached the first obvious target which is the lower bollinger band. The other is broken falling wedge resistance in the 15.5 area, so we might see a further move down on Vix:
One thing that is encouraging for bears here is that EURUSD is now very close to reaching the upside targets that I have given over the last few days, having touched 1.3405 overnight. The IHS has already played out to target, and I had the pennant target in the 1.341 area. I have trendline resistance in the 1.3415 area and a reversal there would at the least mean that SPX would lose the short term uptrend support that a spike up on EURUSD delivers:

Oil spiked up very hard yesterday after hitting short term rising support and I had a nice looking rising wedge going there until CL blew through the upper trendline last night. That might be a wedge overthrow of course, but if it isn't then I'm not seeing much resistance between here and last year's high in the 115 area. I won't show it today but I do have a possible IHS on the daily chart indicating to the 130 area and that's something to bear in mind, especially as declining resistance from the 2008 high also broke yesterday:

Every so often I chat to parents of my childrens' schoolfriends at parties and so on, and in late 2010 I remarked to one of those parents that I was expecting that rising food prices would destabilise and topple some governments in poorer countries. As the Arab Spring then unfolded during 2011 with governments toppling in Tunisia, Egypt and Libya, and with unrest and unsuccessful (so far) uprisings elsewhere, my reputation as a seer with him was firmly established, so late last year he asked for another prediction for 2012. I replied that though it might well not happen, I was seeing a real possibility that oil prices might hit $150 in 2012.
That wasn't a chart target and regional instability is obviously one factor behind that prediction. The other is the fast changing basis of crude oil demand, with rapidly increasing demand from the world excluding the US, Europe and Japan, only partly masked by gently falling demand there. Oil demand is growing fast and supply is relatively inelastic, so there is a growing imbalance there that can only be curbed either (temporarily) by economic weakness in emerging markets, or by price rising enough to choke off rising demand and increase supply. Throw in instability in oil producing regions and a possible confrontation with Iran, and you have a potentially very explosive mixture. We'll see.
Here's a great chart from Chart of the Day showing the demand levels from the old world and the new since 1987 and you'll see what I mean. You can see the original article here or by clicking on the chart below. I highly recommend their free emails every day with thought-provoking charts covering many areas:

Overall there seems a good chance that the 2011 high on SPX will be tested today, though I'm not expecting a move above 1376 at the most as anything higher would break my very strong resistance trendline. EURUSD is now at my 1.3415 target and we'll see whether that resistance holds. A break above resistance on SPX and/or EURUSD would look bullish and would open up higher targets. We may see early weakness of course as the intraday pattern still strongly favors lows in the first hour followed by a grind up for the rest of the day.
