Further to my last post, I'd offer a caution to bears from getting over-eager on shorting the equity markets while they remain above minor support levels that the YM, ES, NQ & TF had established just before the latest unemployment data was released during pre-market hours on February 3rd. These e-mini futures markets rallied strongly (on nearly-normal-market-hour volumes, which I thought was unusually high) immediately after this data was released before cash markets opened.
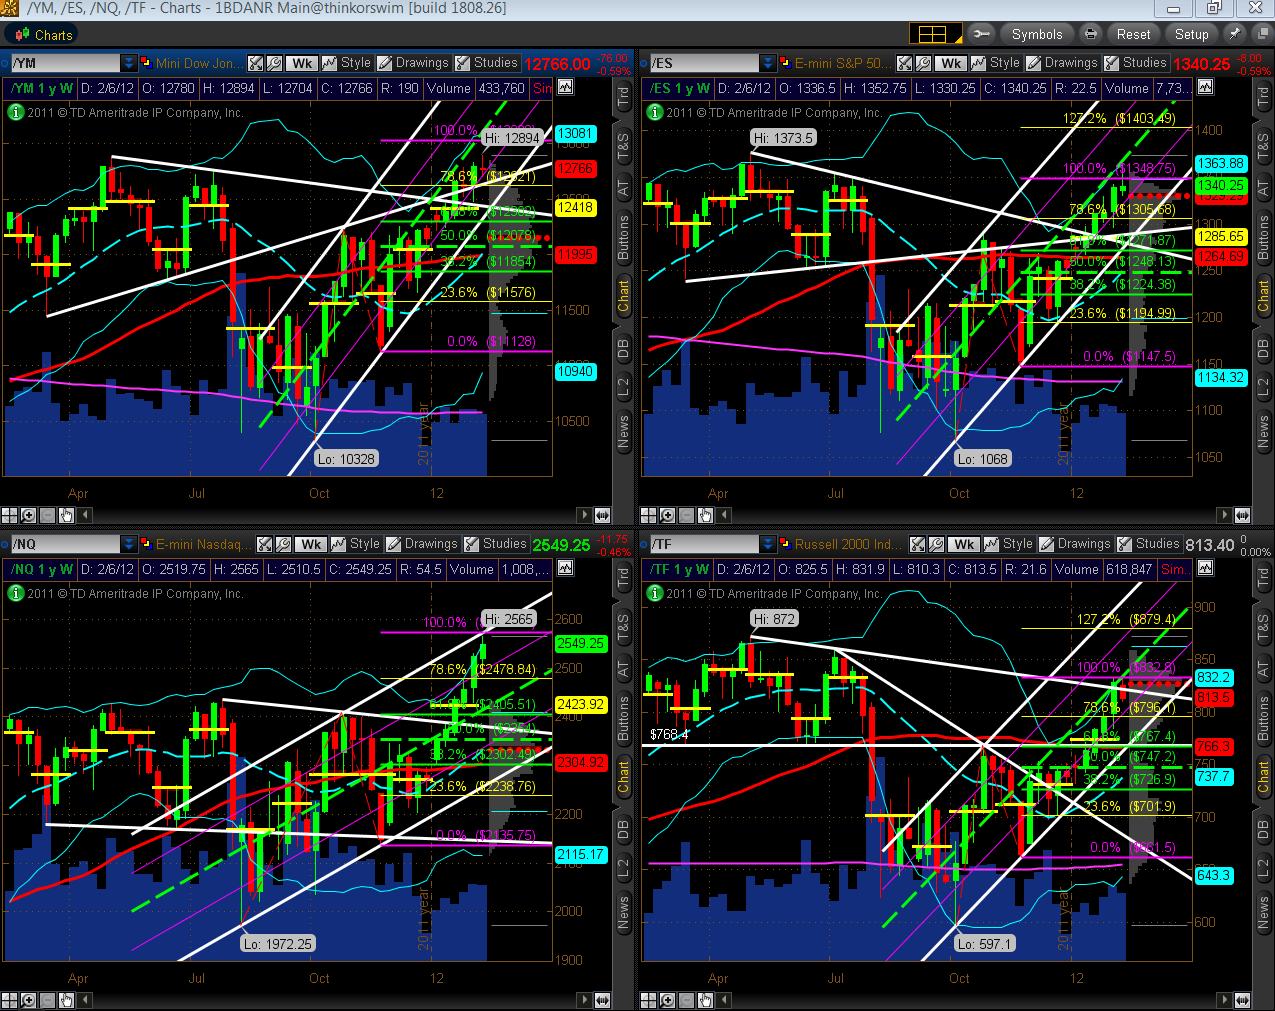
Based on this "unusual pre-market volume" surge factor, I'd submit that short-term support sits at those "pre-release levels." Overlayed on the 4-Hour charts below is a Fibonacci retracement taken from the January lows to the current highs, as well as Bollinger Bands, 50 sma (red) and 200 sma (pink).
As can be seen, the YM, ES and NQ have not yet re-tested that "pre-release level," while the TF almost has and closed just above on Friday. This level for the YM and ES sits roughly in line with the 33% level (yellow) (12671 and 1322, respectively)…although it's not a traditional Fibonacci level, it represents the upper one-third marker of the rally for that defined time period and has merit as an area of support. The level for the NQ and TF sits roughly in line with the 23.6% Fibonacci level (light pink) (2503 and 808.50, respectively).
Until this "pre-release level" is crossed with conviction on decent volumes and held to the downside, I'd say it offers short-term support for these e-mini futures indices. Based on this analysis and the defining parameters, the "given" for any support levels beneath that level would be represented by subsequent Fibonacci levels, as shown.
On the flip side, any further advance above this level on decreasing volumes could be a bull trap in-the-making.