
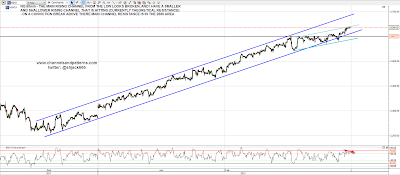
Yet another boring day on equities yesterday with a spike down, low in the first hour and then a grind up for the rest of the day. What were the odds of that? My broken support trendline on SPX from the Dec 19th low crossed the resistance trendline yesterday so I'll now disregard it. Strong rising resistance in the 1378/9 SPX area today:

NQ looks potentially interesting here, with a small and shallower rising channel forming on the break of the main channel from the Dec 19th low followed by the conviction break of 2600. The upper trendline of that new channel is currently theoretical and NQ is testing it. If we see a reversal here then a new tradeable rising channel will be established. Some negative RSI divergence is looking promising for some short term reversal here:
EURUSD bounced at the theoretical channel support I marked in yesterday morning, so a decent rising channel has been established. EURUSD is currently reversing after testing the last high and a possible short term double-top has been setup with a target at 1.3244. If that rising channel breaks down then that may well play out:

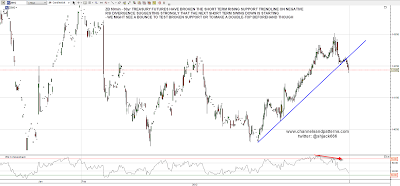
ZB has broken short term rising support which suggests a move down of whatever size. We might see a bounce to make a double-top first though and broken support is being tested from below at the moment:
The big news yesterday was on silver where double resistance at the double bottom neckline and declining resistance from the high was broken with a lot of conviction. Short term SI is looking extended and might retrace, though I have rising channel resistance some way above in the 38.3 area. Buy on any pullbacks IMO:

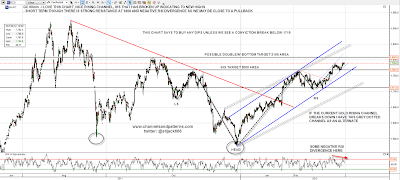
Gold hasn't yet broken the possible double or W bottom neckline at 1808, but with the IHS and rising channel this is already a very bullish chart. Short term gold also looks toppy so we may well see some retracement soon. Like silver, this looks like a chart to buy on any pullbacks:
The last two charts today are from my EW friend Pug. The first is his primary SPX count on the daily, where he is expecting a retracement from this area that will stay above the 1315 pivot. He has a more bullish alternate count if SPX breaks up through strong resistance here and he thinks it might:
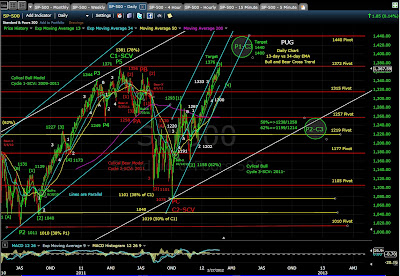
The second of Pug's charts is a very interesting chart where he examines the similarities between this move up and the Feb to April 2010 move up. That 2010 move up is the last time I saw a seemingly endless move that killed so many bearish divergences and trendline breaks and just kept on rising. The move ended just as SPX moved over strong resistance. Pug's not expecting a top like that one here, and neither am I unless we see a retracement below 1292 SPX, but the similarities are striking and SPX has just broken up through a strong resistance level of course. We'll see and at the very least it's a great looking chart:

For today the stats are bearish as it's the last day of the month. 60% closes down at the end of the month since March 2009 and 4 of the last 5 closed down. Tomorrow is the first day of the month and the stats are 65% closes up since March 2009, though it's worth noting that seven of the last ten of these have closed down, and eight of the last twelve, so those first day of the month stats are a good deal weaker than they used to be. In the absence of any surprises today I'd expect early weakness, a low made in the first hour, followed by a grind up for the rest of the day. If ES gets under 1364 that will look encouraging for bears, and there is a possible H&S neckline at 1353 ES where it would be very nice to see a hit.
