
The SPX support trendline broke down yesterday, and the short term high could be in, though I'd like to see a move below 1350 SPX for more confirmation that this seemingly endless up move has finally peaked. Trendline resistance still looks very solid and should be in the 1370 area today. The 2011 high was at 1370.56, and a test at that level would have some technical merit, so I wouldn't rule it out quite yet:

I've been looking at the rising channel on NQ as a decent trend change confirmation, so I was very pleased to see that the NQ low overnight was at that channel support trendline, which strengthens it and makes it a better signal on a break downwards. It is very much worth bearing in mind however that it has not broken down yet. Resistance in the 2600 area still looks solid and the channel support trendline should reach 2600 next Tuesday, so there must be a break either way by then:

I looked at the Transports chart again last night, and inexplicably I managed to miss yesterday morning that the potential H&S there was already fully formed. The correct version is below and there was a tentative neckline break yesterday. The positive RSI divergence at the moment is however a warning sign that we might see a bounce here:

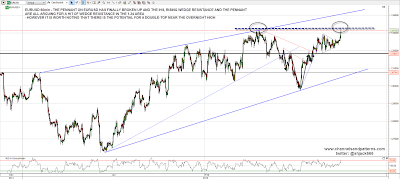
The pennant on EURUSD that I was looking at yesterday morning has broken up, and the rising wedge resistance trendline, IHS, and pennant are all now arguing for a hit of trendline resistance in the 1.34 area, so that looks fairly likely. There is a potential double-top established at the overnight high however, so that's worth bearing in mind today:
Gold broke my IHS neckline on the daily yesterday, which is very encouraging. However there is an important resistance test coming up on both gold and silver to confirm that the primary trend on both is now up. On gold that test is at the potential double-bottom base/neckline in the 1810 area and a break above there would target the 2100 area:
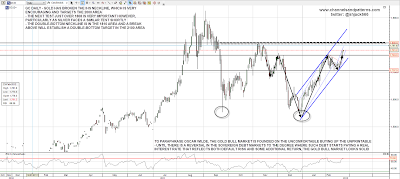
The chart to watch with that gold chart is the silver chart, where there is an equivalent potential double-bottom base/neckline at the 35.75 level. That test is really important as there is double resistance in that area, with declining resistance from the silver high reaching the 35.75 level within three or four days. If silver and gold can clear these levels the path looks clear for a further strong move up over the next few months:

The last chart today, apropos of nothing in particular, is the surprisingly grim looking monthly (LOG) chart for PepsiCo. I was talking to my wife about this yesterday and she was saying that it was a surprising chart to see for such a decent looking blue chip company. I replied that I agreed, and that the grim looking setup might well not play out, but added that it was worth dumping from any long term buy and hold list just in case it did. Not every chart that looks like this ends with a waterfall decline by any means, but many waterfall declines start with a chart that looks something like this one. The RIMM chart I posted last May just before the massive decline is a good example of that and you can see that here:
+Trendline+and+DT.png)
I think that the short term SPX top is close or already in. For confirmation that the top is in I would like to see SPX below 1350 and a break down from that rising channel on NQ. I am still seeing some potential for a new high on SPX that would test the 2011 high at 1370.56 and would probably coincide with a test of trendline resistance on EURUSD. If we see that it would be a very nice looking short entry level for both with stops not far above.
