
There is always a conflict when you see short term patterns for during trading hours on both an index and its 24 hour futures equivalent. An H&S pattern completed the head on SPX and ES yesterday, and there was a clear short term double bottom on both at the lows yesterday. On ES overnight that double-bottom has played out to target, and the H&S is now largely formed. Where does that leave these patterns on SPX? It may be that we will see that right shoulder bounce on SPX this morning, as a sort of echo of the overnight ES move, but for the moment I would treat the ES move as completion of that double bottom, and disregard the setup on SPX. We'll see how that develops this morning.
For the most part ES has followed the roadmap I set for it yesterday morning, and with caveats, that looks bearish. On the bear side the low yesterday was 1.5 points below my 1384 target (with hourly close above) and the overnight high was one tick over the 1393.5-5 range I gave then for the ideal bounce high to make a right shoulder on the potential H&S I was looking at. So far so good, as that H&S is very much in play and almost fully formed now. On the bull side the short term declining resistance trendline I wanted to hold at that high was broken,and that opens up the possibility that the main declining resistance trendline from the high, currently in the 1202 area, may be tested. If we see that test, the symmetry of the part-formed H&S would be fatally weakened. Overall, with ES at 1387.50 as I write, I'm leaning cautiously short, with that turning to definitely short on a break below yesterday's low with any confidence, with an H&S target in the 1360 area, neutral on a break above the overnight high at 1395.25, and bullish on a break above declining resistance from the high in the 1402 area. Here's how that looks on the ES 60min chart:

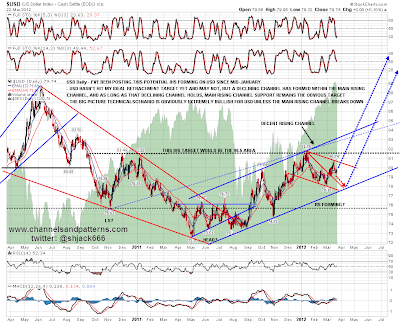
That ES chart will be my only equity chart today, as it seems clear enough really, and I'd like to look in detail at the interesting setup on USD and precious metals here. EURUSD did not make it to the 1.31 area yesterday, reversing strongly at 1.3133. It then made a slightly higher high overnight, potentially completing the bullish IHS that I've been talking about, though there is an argument that this is only the completion of the head on that pattern. Direction is uncertain while EURUSD is trading within the consolidation range that I have marked on the chart below, and would become strongly bullish on a break above 1.33, bearish on a break below yesterday's (potential double-top valley) low at 1.3133, and strongly bearish on a break below 1.30:

I've been cautious on overall EURUSD direction here, and part of the reason for that is the USD chart. On that chart I've mentioned a few times that my ideal retracement target for USD has not yet been hit, and you can see from the daily chart below that I have USD in an overall rising channel from the April low last year. The obvious retracement target is a touch of the support trendline on that channel. Since the last touch of channel resistance in January, a falling wedge formed on EURUSD that then evolved into a declining channel within the overall rising channel. Until that smaller declining channel breaks up the obvious next target is a hit of channel support slightly under 78, and that supports the short term bullish EURUSD scenario. If it should break up, then that would then support the bearish EURUSD scenario. Time will tell, and as long as that larger rising channel on USD holds, the bigger picture on a break upwards is the huge two year IHS that is forming with a target in the 90.5 area, so the bigger picture on USD remains strongly bullish:
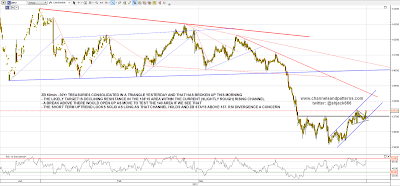
I mentioned that ZB was looking short term overbought yesterday and it formed a consolidation triangle which then broke up overnight to a (so far) marginal new high. On the upside I'm looking for a touch of declining resistance in the 138'15 area, but it needs to move up with some conviction soon, as the current marginal new high on negative RSI divergence is obviously potentially bearish. If we see a reversal here then I have both level and rising channel support in the 137 area. A break below there would suggest that this little bounce on bonds is most likely over, and the bigger technical picture on bonds is obviously strongly bearish here:
The other three charts are all for precious metals. I gave a downside target for gold in the early 1600s some weeks ago, and that was almost reached yesterday. This is a major inflection point for gold and precious metals generally in my view. If gold can reverse back up near here then the IHS I was talking about then is very much in play with a target at new highs. On a break down we might see a large correction in precious metals, though I have marked two other significant support levels down to 1500 on the chart below:
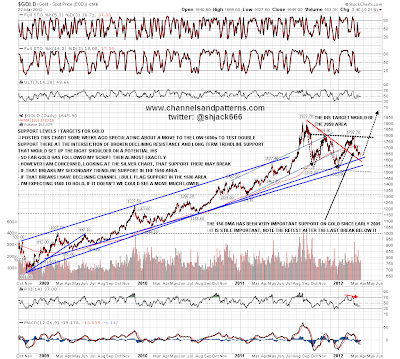
The reason that I think the key inflection point is here is for three reasons. The first is that gold tends to retrace in the first three months of the year to make a low that then holds for the rest of the year. You can see from the chart above that it did that in each of the last three years, and we are now near the end of March. The second reason is the large H&S that has clearly formed on the GDX chart, completed on Tuesday with the neckline tested again yesterday. H&S necklines are strong support until they are broken. On a break below however, we may well see a very large move down on GDX, which would most likely be in the context of a similar move down on precious metals:

The third reason is that a smaller, but very clear H&S has formed on platinum since rising support from the December low broke a few days ago. Again 1600 is strong support until it breaks but again, a break down would probably be in the context of a wider breakdown on precious metals:

Overall I'm leaning cautiously bearish on equities today, but I'm watching carefully to see whether overhead resistance on ES and EURUSD is broken, and whether support on ZB holds. I'm still of the view that this is a counter-trend reversal, and it looks fragile this morning. We need to see a definite move down to confirm the bear scenario, and that should be as early as possible in trading hours today. If we are going to see a break down then Friday is the most bearish day of the week since October and the best day to see that. If we don't see that break down today, then yesterday's low could hold for weeks, and I would be watching declining resistance on ES from the high to signal a possible bullish break up.
I'll be out for most of the session today. I've added a column on the left to my blog overnight and widened the page. Please have a look and tell me if you think that it is now too wide. I had a few requests for larger charts yesterday, but I've reached the maximum size that the site template will allow. If you click on any chart however, you will link through to the full size version at screencast, and you can click on that again to enlarge it further. The link to my blog is here.
