
There have been two main schools of thought on the bull side over the last few weeks, and the first expected that this retracement would be shortish, and would be followed by a wave 5 move to take equities to new highs and an interim top before a much bigger summer retracement. The second have been expecting a much bigger retracement now, probably taking us through May and slightly beyond, before a big renewed push up in the summer. We are most likely at the point of decision between those two scenarios now. A break up should deliver the first scenario and a break down may well deliver the second. I should stress that I've not entirely discounted alternative bear scenarios, but unless we see a clear topping pattern followed through to below the 1292 SPX October high, it's not worth spending much time on these IMO.
As I suggested was likely yesterday morning, SPX pushed up to test the highlighted strong resistance area and the last bounce high, and has reversed there so far. A break over 1396 will trigger a double bottom (and arguably IHS) target over the last high and the obvious next target not far above there is the 1442 pivot level. Short term there is significant negative divergence on the 15min RSI and that is a strong signal for reversal UNLESS we have started a new impulse wave up. If we see weakness today I'm seeing strong support in the 1377 area, and a move below there would weaken the bullish scenario here:

The picture isn't mirrored on the NQ 60min, but the technical setup there gives similar upside targets. On NQ the double-bottom target I gave yesterday was made and declining resistance has been tested overnight. That trendline is the upper trendline of a (69%) bullish broadening descending wedge with a target at the 2012 high. There is clear negative divergence on the 60min RSI and we should see reversal here unless, as with SPX, we have started another impulse wave up. For this reason, as with SPX, a resistance break here would be a very strong bullish signal and should be respected:

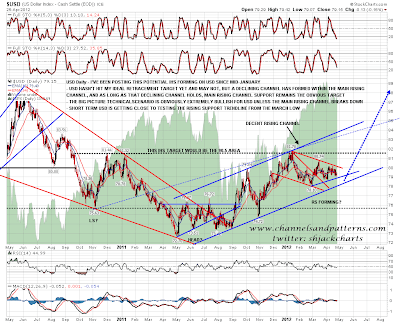
The picture on equities looks so clear here that there's really little else to add. For the remainder of the post I'll therefore have a look at where we are on USD and Gold. GBPUSD has been trashing my rising wedge resistance trendline overnight so USD may well see further weakness short term. On the overall USD chart that I've been posting since January, we are approaching a test of rising support from the March low, and if that breaks then my bigger picture retracement target just over 78 will be within easy reach. I need hardly say that the move on USD since January looks corrective and has formed a bull flag, and after USD reaches my retracement target I'm expecting a strong move up to complete the large IHS that has been forming:
I posted a gold chart in early February speculating about a possible IHS that may be forming there to take gold to new highs. Since then gold has retraced to test my primary support target at rising support from the 2008 low. If we see further weakness then I have marked further support levels on the chart, and looking at the GDX chart particularly, there is certainly an argument that we may see that weakness. However gold may be making a very significant low here, and if we see gold break back over the 150 DMA at 1684 with any confidence, then I'll be leaning strongly bullish on gold and PMs. We shall see:

A short post again today, but the equity picture looks very clear, and to be honest I'm not feeling 100% at the moment, which is why I was very quiet yesterday. I'm watching overhead resistance today on NQ particularly, but also SPX. I'm leaning towards seeing some weakness today regardless of whether we are going to see a break upwards on the bigger picture, and if we see that weakness, I would see a conviction break below 1377 SPX as a strong signal that the Monday lows may well be retested shortly. The picture on bonds is unclear, but as ever I'll be leaning short on bonds if equities break up, and long if equities break down.
