
There are three main options that I'm looking at on SPX over the next few days and today is the key day for the first option:
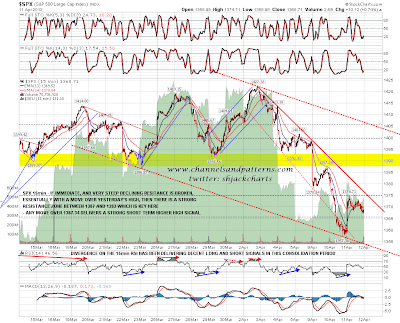
1. We see a failure at immediate declining resistance (best seen on 15min chart) under the lower bollinger band and the daily 50 SMA as well, so this is a strong resistance area. This option sees an immediate continuation of the downtrend with a likely low made in 2 to 4 days.
2. SPX breaks over this very steep declining resistance and heads towards the middle bollinger band and potential channel resistance in the 1400 area. Depending on the speed of the rally we may well see failure at resistance just over 1390 (1387 ES area) before the downtrend resumes.
3. SPX breaks over that resistance, the middle bollinger band, and potential channel resistance to test the highs and if broken, then moves up to test the 1442 SPX pivot level.
For the last two options I'll be watching the 15min RSI for negative divergence from overbought. If we see that then that would be a strong short signal. If that then failed to deliver a new low I'd be expecting new highs soon. Here's how that looks on the SPX daily chart:

Here's a closeup on the SPX 15min chart showing the immediate declining resistance trendline in more detail, and defining the strong resistance zone between 1387 and 1393:
I mentioned that copper had broken support at 370 and here's the chart showing that. This looks ominous longer term as similar weakness was an early warning signal of the equity top last year. Short term copper is rallying and first resistance is obviously at 370:

I have serious doubts about the large H&S on EURUSD playing out, as I've been saying regularly. So far however the rally from the neckline is looking very much like a bear flag and EURUSD is now testing decent resistance at 1.31825. A break over that opens up a move to more serious resistance at 1.32825:

A decent declining channel has formed on CL since the March high, and oil is currently rallying on strong positive RSI divergence. I have channel resistance in the 105.5 to 106 area with strong resistance in the 104.5 area

I've mentioned before that I browse quite a few sites in the morning looking for anything interesting. One of those sites is Perfect Stock Alert, who do excellent nightly analysis videos, and I thought this morning's posts on hammer candle reversals within trends was particularly good, so I've embedded it below:
The last four Thursdays have closed red, and there is strong resistance today on SPX at yesterday's high, declining resistance, the daily lower bollinger band, and the 50DMA. We may well see failure there and continuation of the downtrend. If SPX breaks over those, then that would extend this rally towards the 1390-1400 area and the next strong resistance levels there. The ball will then be with the bulls and we'd see how far they can get with that. If we see failure today then that would ideally be at declining resistance to strengthen the trendline as an indicator of when the decline has finished.
