
Further to my last weekly market update, here is a summary of where money flow ended for Week 1 of May 2012.
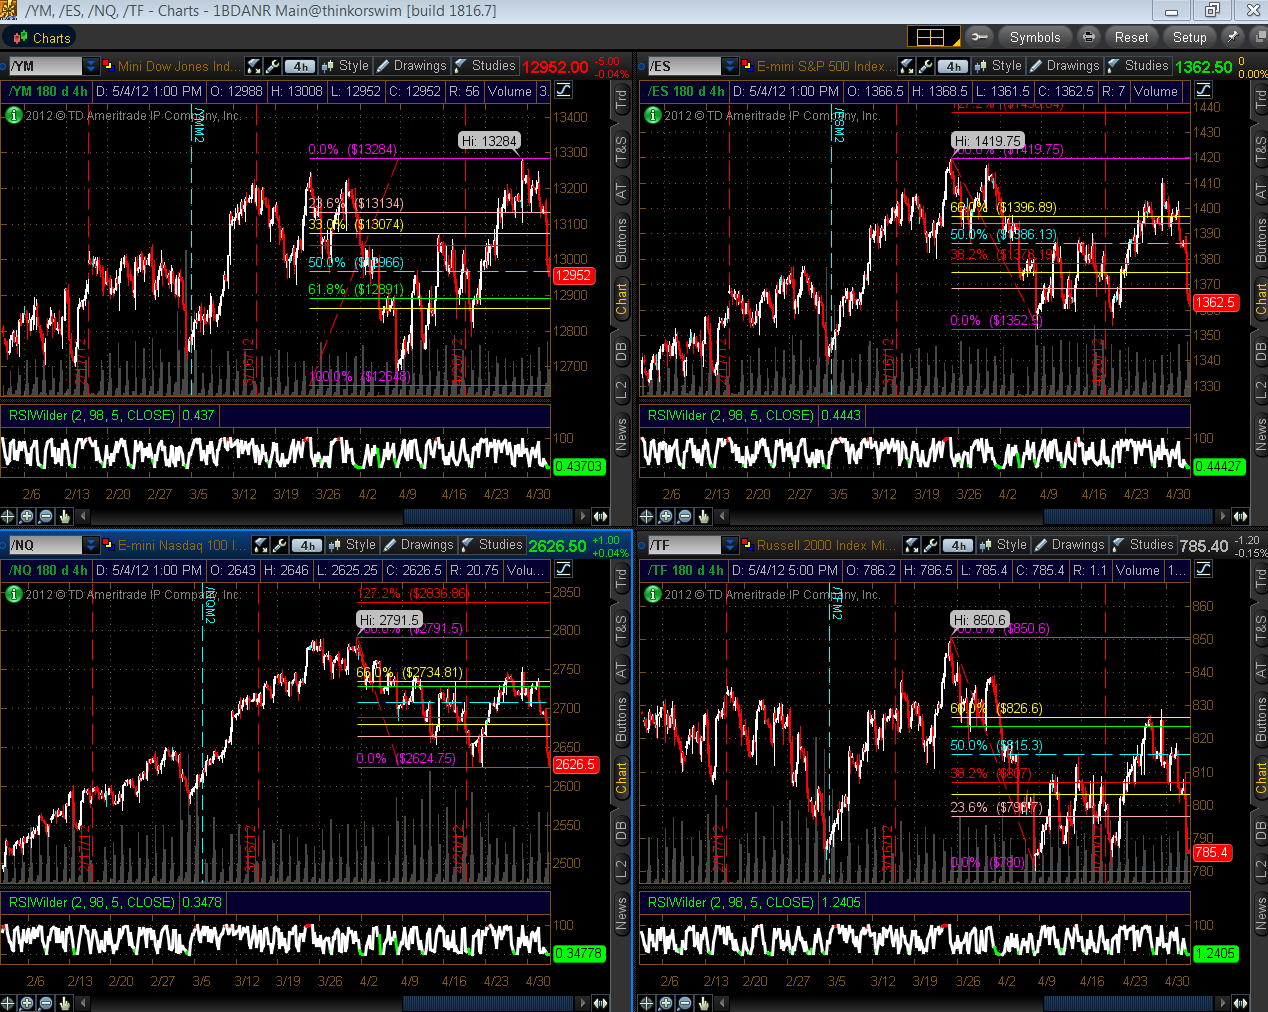
The Weekly charts below of YM, ES, NQ & TF show that they reversed last week's bullish setup to close as bearish engulfing candles. They are still range-bound from February. Until we see price break out of this range one way or the other with conviction, we may see an attempt at a bounce on Monday.

As I mentioned in my market update of April 13th, I'm assigning a weekly bullish or bearish rating on YM, ES, NQ & TF until the end of this year. Please refer to that post for the parameters, and to the Weekly charts below. As of this past week's close, the ratings for next week are as follows:
- YM = mildly bearish
- ES = mildly bearish (bordering on moderately bearish)
- NQ = moderately bullish (bordering on mildly bullish)
- TF = mildly bearish (bordering on moderately bearish)
I'll re-iterate what I said in my last post about the NQ, namely: The NQ's volume in the Volume Profile from February onwards is very thin, which signals a potential weakness/problem in this e-mini futures index being able to advance much further and hold above its 2011 highs. I wouldn't be surprised to see price drop back to this level at some point and further buying volumes finally enter to support a convincing rally…no doubt this would have a negative impact/drag on the other three indices.

The 4-Hour charts below of YM, ES, NQ & TF show their respective intraday ranges from the latter part of March to Friday's close. The YM is just below the 50% Fibonacci retracement level, and the ES, NQ & TF are near the low of their respective ranges. In the short term, if I were to apply the same rating parameters as above, the YM is mildly bearish, and the ES, NQ & TF are bearish. If they break and hold below these ranges, they would each, potentially, have a target of:
- YM = 12012
- ES = 1285.25
- NQ = 2458
- TF = 709.40
The three Daily charts below depict support and resistance levels on the percentage of Stocks Above 20-Day, 50-Day, and 200-Day Averages.
Stocks Above 20-Day Average closed well below last week at 36.83%.

Stocks Above 50-Day Average closed well below last week at 36.85%.

Stocks Above 200-Day Average closed well below last week at 61.08%.
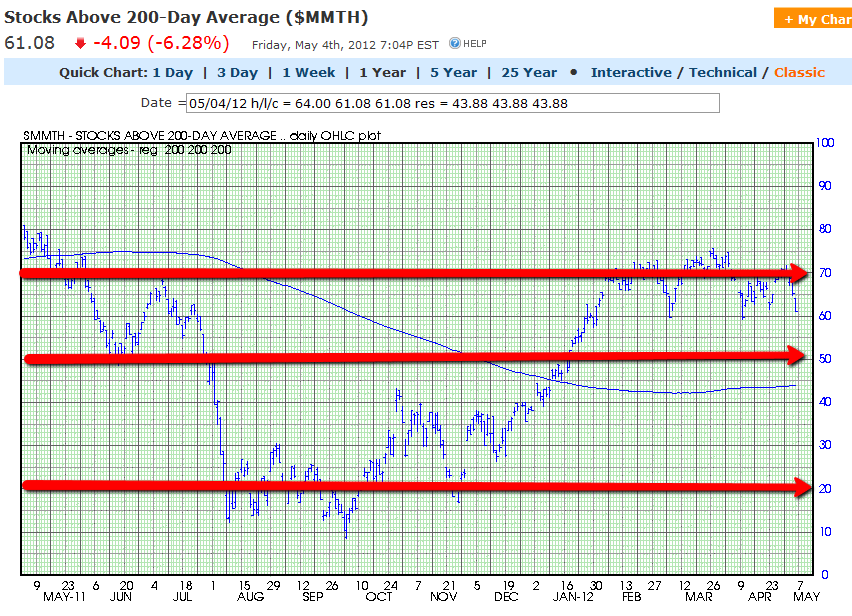
I'd conclude that, in the short term stocks are moderately bearish, in the medium term stocks are moderately bearish, and in the longer term stocks are mildly bullish…but, as has been the case for the past six weeks, all are still on negative watch for further potential weakness.
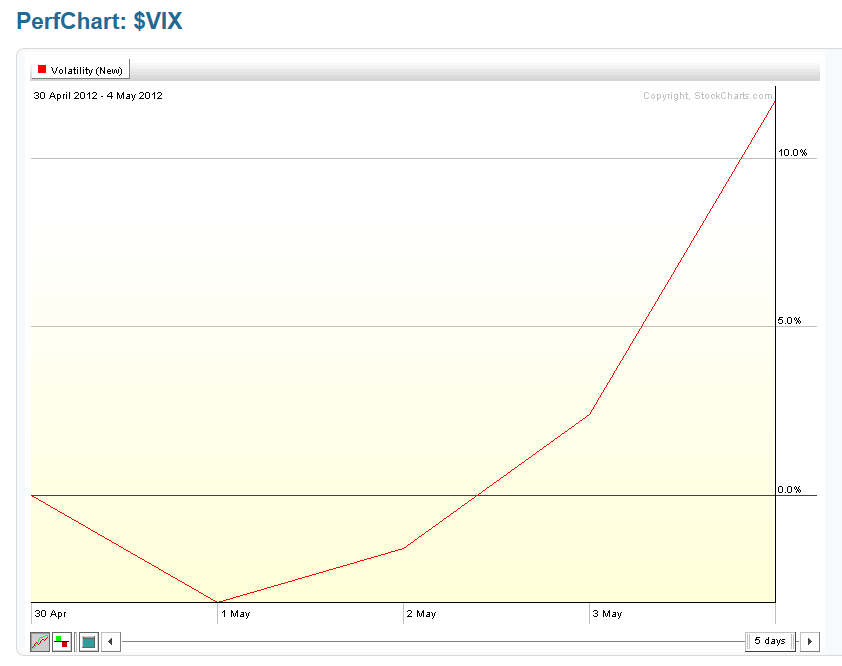
The VIX rose on the week (by 11.72%), as shown on the graph below.
Further to the comments in my last weekly market update, the Daily ratio chart below of the SPX:VIX shows that that the SPX declined and closed below its 50 sma, once again, and just below an uptrend line from the October 2011 low. The RSI, MACD, and Stochastics indicators are trending down and are not oversold. Near-term resistance is at the uptrend line at 73.00, then the 50 sma at 82.00, and support is at 65.00, then 60.00, and then the 200 sma at 55.81…important levels to watch.

As shown on the graph below of the Industry Groups, they all declined, with Oil, Gold/Silver, and Brokers leading the losses.

As shown on the graph below of the Major Sectors, they all declined, with Energy, Materials, Technology, and Financials leading the losses…the defensives (Consumer Staples, Health Care, and Utilities) lost the least.

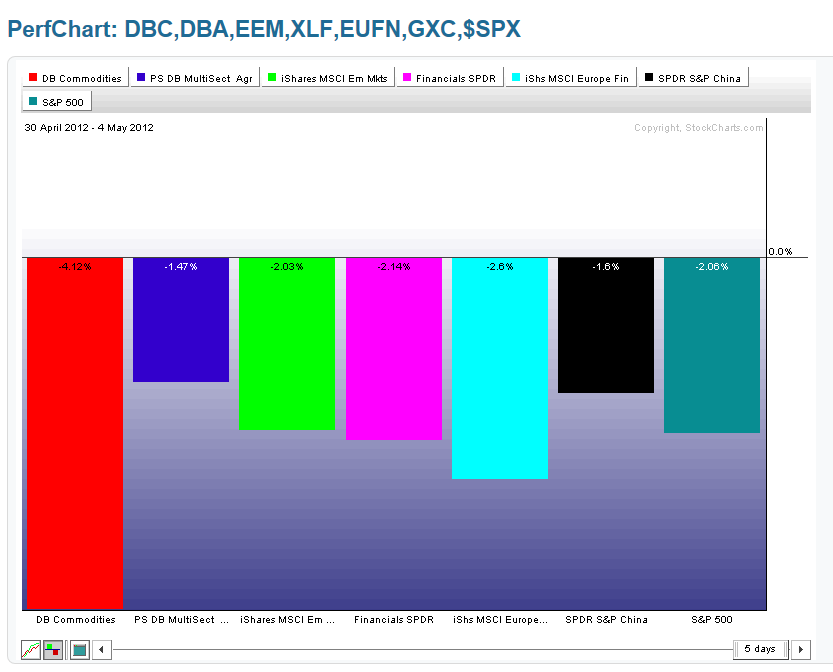
As shown on the graph below, the biggest losses were in the Commodities ETF (DBC), followed by the European Financials ETF (EUFN), the U.S. Financials ETF (XLF), the Emerging Markets ETF (EEM), the Chinese Financials ETF (GXC), and the Agricultural ETF (DBA).
Further to my post of May 2nd, the SPX and DBC both declined into Friday's close, as shown on the Daily comparison chart below…two I'll be watching for either continued correlated or divergent moves for the coming week(s).

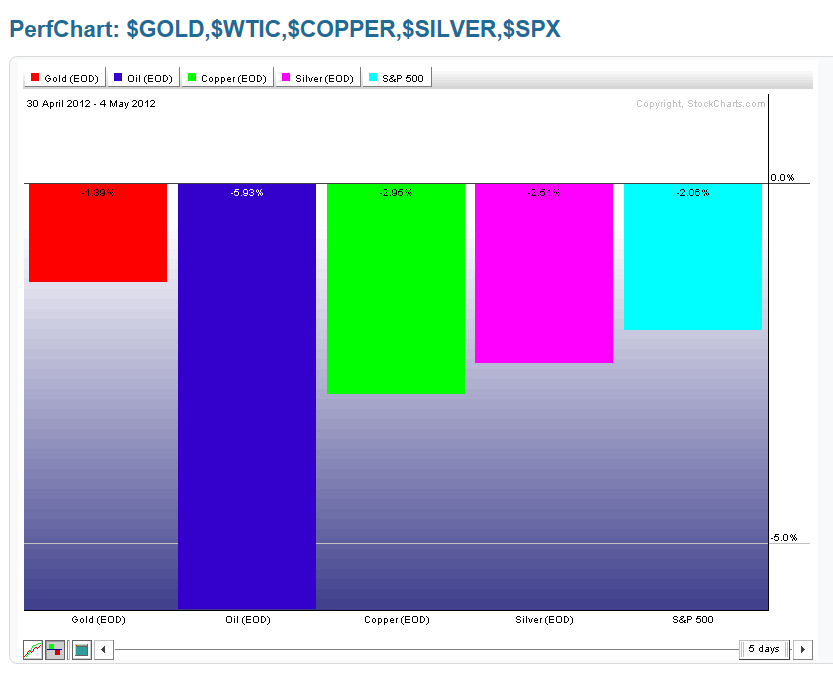
As shown on the graph below, the largest losses were made in Oil, followed by Copper, Silver, and Gold.
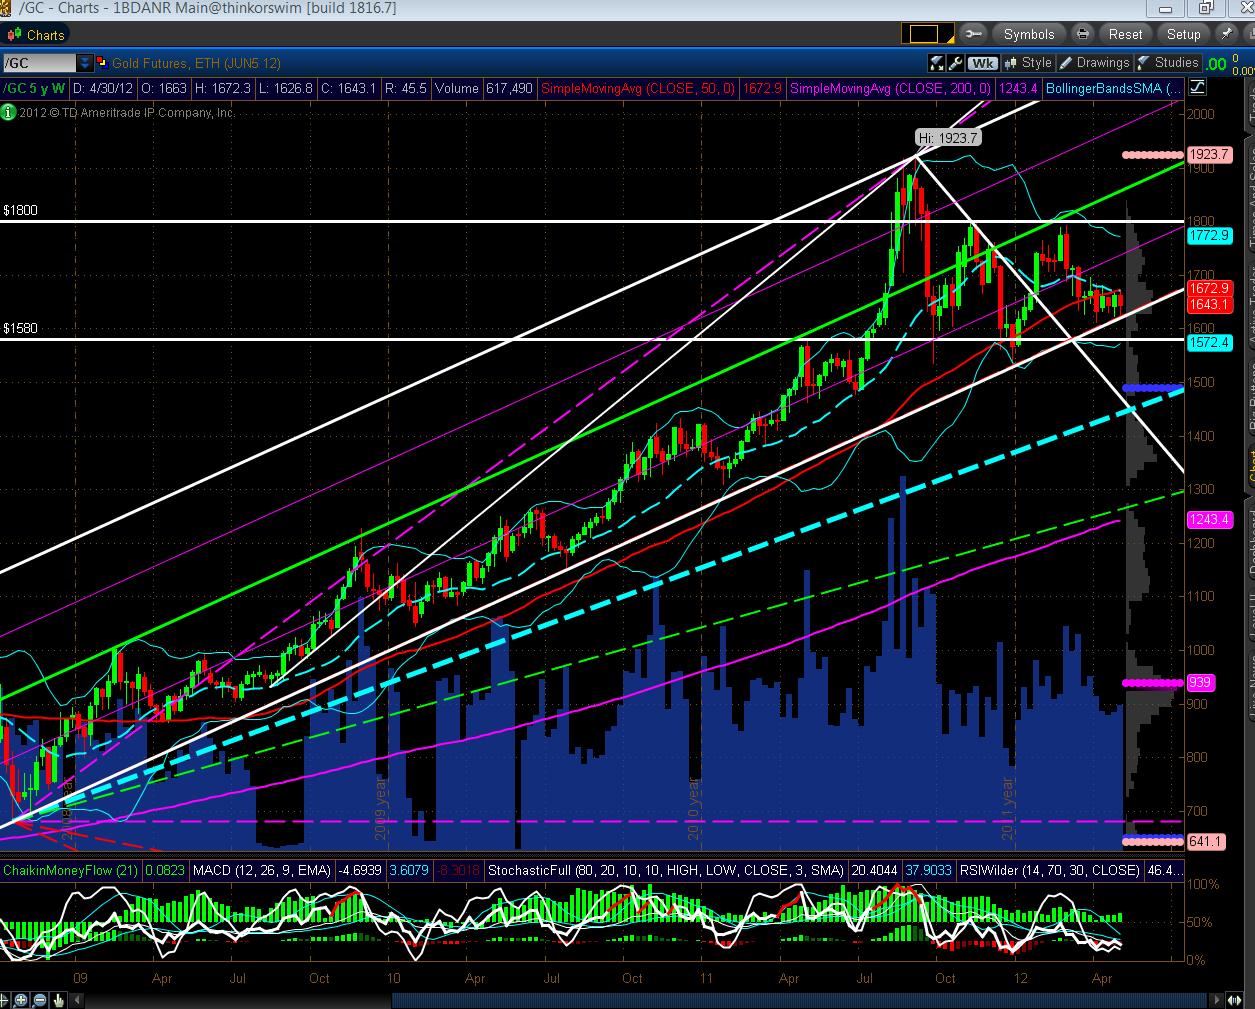
The following four Weekly charts of Gold, Oil, Copper, and Silver show support and resistance levels…ones to watch, particularly Gold, Oil, and Silver.


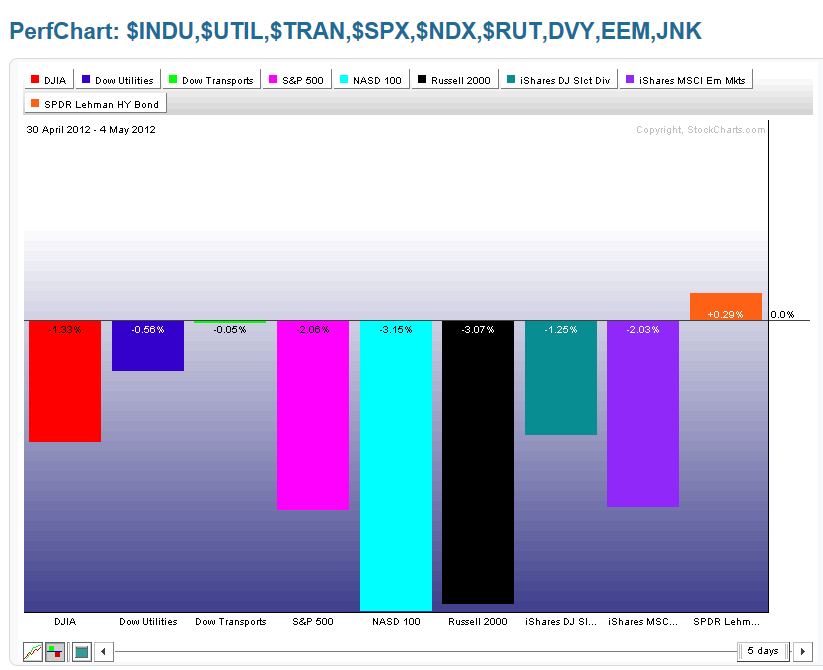
As shown on the graph below of the Major Indices, the Nasdaq 100 made the biggest losses, followed by the Russell 2000, S&P 500, Dow 30, Dow Utilities, and Dow Transports. Losses were also made by the Emerging Markets ETF (EEM), and the High Dividend-Paying Stocks ETF (DVY). Minor gains were made in Corporate Bonds (JNK).
As shown on the currency graph below, money flowed into the U.S. $, and out of the Aussie $, the Euro, the Canadian $, and the British Pound.

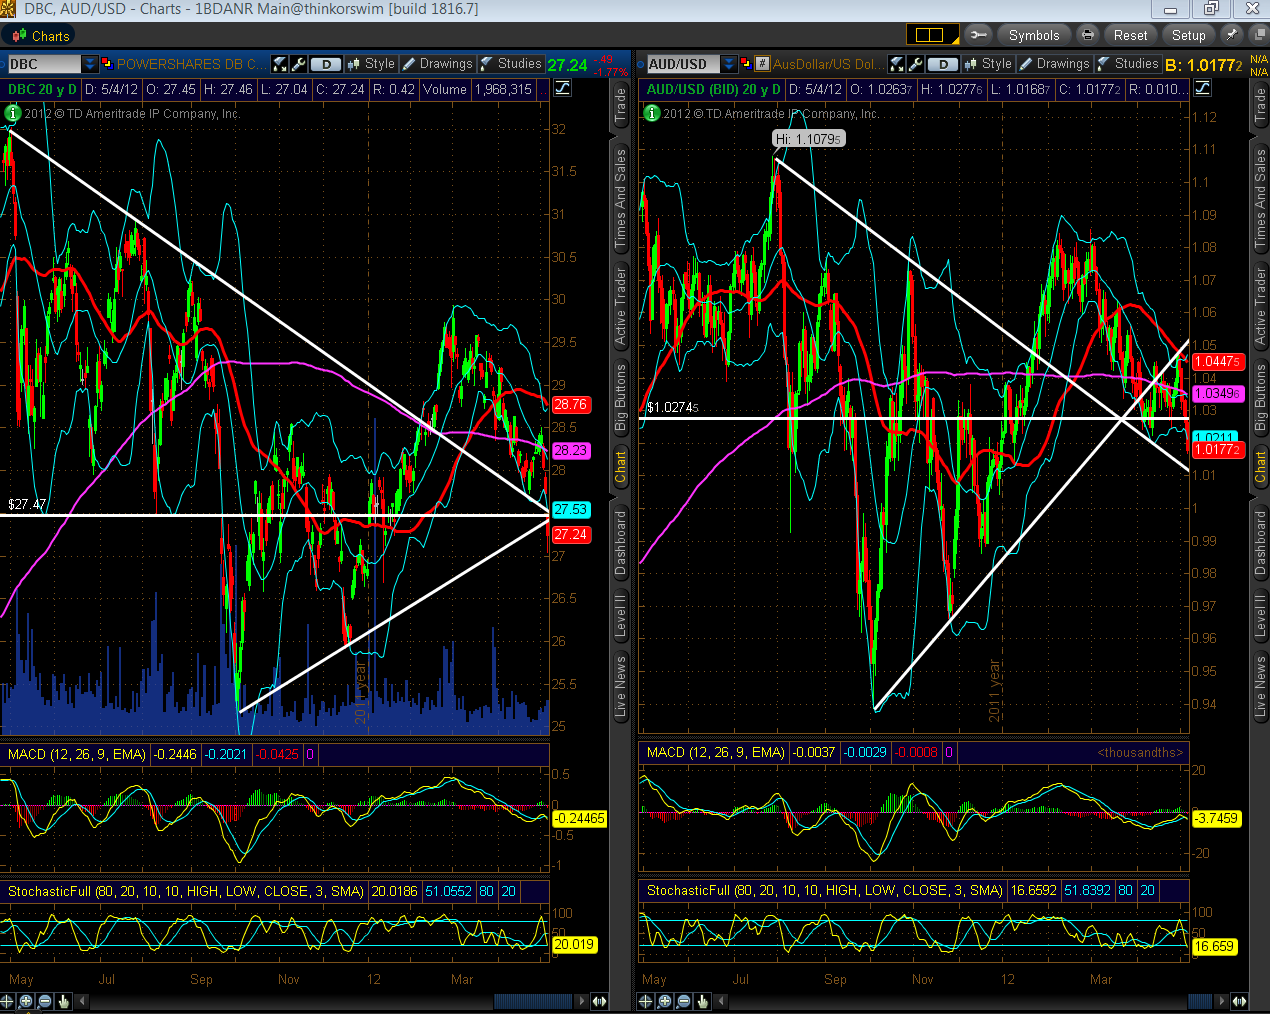
Further to my post of May 3rd, the similarity in price movement continued into Friday's close, as shown on the comparison chart below of the Commodities ETF (DBC) and the Aussie $. The second chart shows that DBC closed below trendline and price support, while the AUD/USD forex pair closed just above trendline support, but below price support. Further weakness in both of these could drag the equities markets further down…two to watch for further direction.

The Daily ratio chart below of the SPX:U.S. $ shows that the SPX weakened in comparison to the $ and now sits below the confluence of the 50 sma at 17.47 and the major uptrend line from the October 2011 low (now major resistance). Near-term support is at 17.00, and major support is at the 200 sma at 16.35. The RSI, MACD, and Stochastics indicators are all trending down. Ones to watch to see if the SPX continues to weaken against the U.S. $.

In summary, the markets failed to continue their trek upwards and were more influenced by negative economic data releases than they have been since their October 2011 low. This weakens the argument in favour of further advances to new highs for this year in the very near term. It will be interesting to watch the markets' reaction to the May 6th French and Greek elections next week, and to see whether the Major Indices break below their sideways ranges on accelerating downward momentum, or whether they attempt to bounce on Monday. Either way, I'll be watching to see whether more volumes enter the markets next week during intraday action, and in which direction they dominate (and whether they can be sustained), in order to judge relevant moves with conviction.
Enjoy your weekend!
