Regular readers know of my fondness for shorting skanky-clothier Abercrombie & Fitch. This was a marvelous short back during the glorious days of 2008, and – – as with so much else – – it's repeating the same performance. This is my best performer today.
Slope of Hope Blog Posts
Slope initially began as a blog, so this is where most of the website’s content resides. Here we have tens of thousands of posts dating back over a decade. These are listed in reverse chronological order. Click on any category icon below to see posts tagged with that particular subject, or click on a word in the category cloud on the right side of the screen for more specific choices.
My Trading Strategy This Month in One Picture
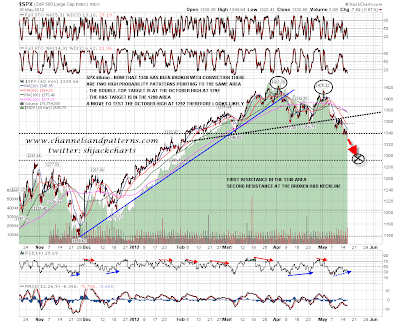
1340 SPX Support Broken
1340 SPX broke with some confidence yesterday and is no longer strong support. The double-top and H&S targets on SPX are in the 1292 area at the October high and that is the next big support level on SPX. Those are both high probability patterns and looking at a wide spectrum of charts this morning the odds that we will see that test in the next few days or weeks looks good. Everything looks oversold and we may well see some decent bounces on the way however. These bounces will look like good short entry points. Here's the SPX 60min chart:
Heart of Wave Down (by Avi Gilburt)
These are the types of trade set ups we like to see. Today, we were able to narrow down a short trade set up to within one point of our ideal target top of 1343.50ES (with the market topping at 1342.50), and provide a target of almost 20 points lower at the 1325.50ES level.
Based upon the current count, it does seem as those we are in the heart of a wave iii of a larger wave (5) of yellow 5 of the c-wave of a wave (4). For this to follow through, the market should remain below 1332, and MUST remain below 1334, which would then provide us with the target of 1320ES as the wave (5) of iii, as you can see on the 3 minute chart. We then normally see a wave iv bounce up to the 1.00 extension at 1328/29, followed by a drop down to the 1315-1318ES region. Normally, I like to target the 2.00 extension. However, since we have an overlapping 1.382 extension on the 60 minute ES chart for a wave c target, which coincides with a 1.764 extension on the 3 minute chart, I do like that target much better. My alternative target will be the 2.618 extension on the 3 minute chart, which coincides with the 1.618 larger extension for the wave c at 1306ES.
So, for tomorrow, I am expecting a potential bottom to this c-wave, which is also within the Fibonacci timing window we mentioned in the Weekend Analysis. At that point, the week after this bottom will clarify if the markets are heading up to make new highs (with a move over the 1352ES level) or if we have topped and are only moving up in a wave 4 of a larger degree 5 wave decline from the recent market top.
Originally published on ElliottWaveTrader.net.
