Slope of Hope Blog Posts
Slope initially began as a blog, so this is where most of the website’s content resides. Here we have tens of thousands of posts dating back over a decade. These are listed in reverse chronological order. Click on any category icon below to see posts tagged with that particular subject, or click on a word in the category cloud on the right side of the screen for more specific choices.
We’ve Been Mostly in a 30-Point Range for a MONTH
Wave Count Pointing Lower (by Avi Gilburt)
Tonight I am going to go out on a limb and say that I think we will see at least the 1280’s and potentially lower by tomorrow morning. In fact, I would not be surprised to even see the 1230-1245 region by the 19th of the month.
Based upon our current chart, while it is still "possible" that we have bottomed in a green wave ii – which, if you noticed, I took off the chart this evening — I think that it is a much lower probability than as of this afternoon. Rather, if a wave 2 is going to bottom, it would be at a much lower level. Of course, if the market is over the 1321 level by tomorrow, it clearly tells us that we are heading up to 1352, but I don’t think that is the most likely scenario into tomorrow. But, this is the overnight risk I mentioned earlier, and is why I suggested to be hedged tonight if you remained short overnight.
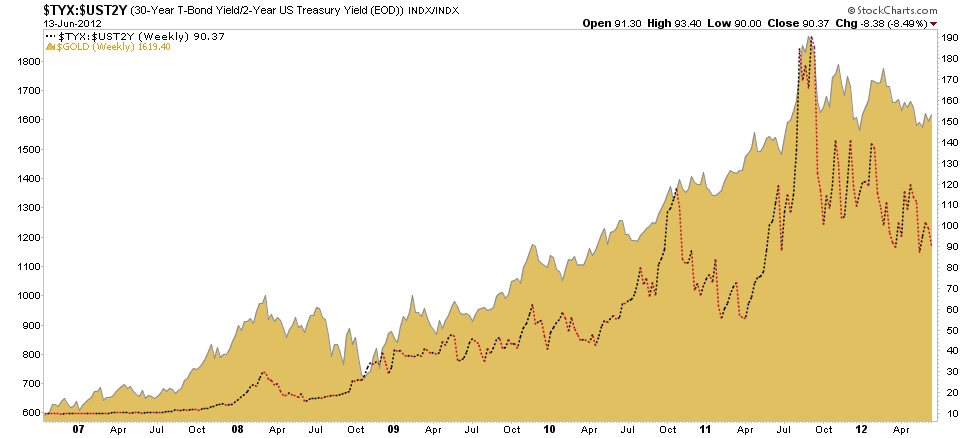
A Byproduct of the Twist? Gold Manipulation
As the world awaits the Greek election, there was news today right here in Wonderland:
Treasurys rise after record-setting auction
Our great nation is selling more bonds (AKA debt) this week to keep itself afloat. Guess what? Demand was strong for 10 year notes.
Next up, 30 year debt will be peddled on Thursday. With the Fed on the bid, either in action or in implied waiting, one might expect that to be another bumper day.
"On Tuesday, the government garnered weak demand at its sale of 3-year notes. That could have been due to expectations for more Twist from the Fed, which may entail selling that maturity. That logic would also have lent support for the 10-year auction, and presumably the long bond sale in the coming session."
The indisputable message of this chart is that gold generally goes in alignment with the 30 year/2 year yield spread.
Bullish Reversal Patterns (by Springheel Jack)
Of the many forecasting tools that can be used to predict the future using the past, possibly the worst is extrapolation, though it is probably also the most widely used. Extrapolation is a process of rationalising that whatever has been happening recently has been for strong fundamental reasons, and will therefore continue, and it is extrapolation that makes people buy at highs and sell at lows.
Possibly the most famous person to forecast mainly, or possibly only, using extrapolation was Alan Greenspan, who in my view was one of the worst central bankers in history as a result. He made a number of famous strong calls in the 1970s and 1980s forecasting major continuations at big highs and lows, and it was these calls that led to Senator Proxmire describing his forecasting record as the worst that he had ever seen at Greenspan's confirmation hearing in 1987. Did he learn from his mistakes then? Well …. no, and it was Greenspan using his abysmal forecasting skills to direct the US economy that led to two of the largest speculative bubbles in history, and the consequent hangover that the world is likely to be suffering through for quite a while longer.
