
The first two Daily charts below show the profit-taking that is
occurring in the Nasdaq 100 Index. It's currently sitting at the lower end of
its smaller, steeper upward-sloping channel as I write this during intraday
action on Tuesday.
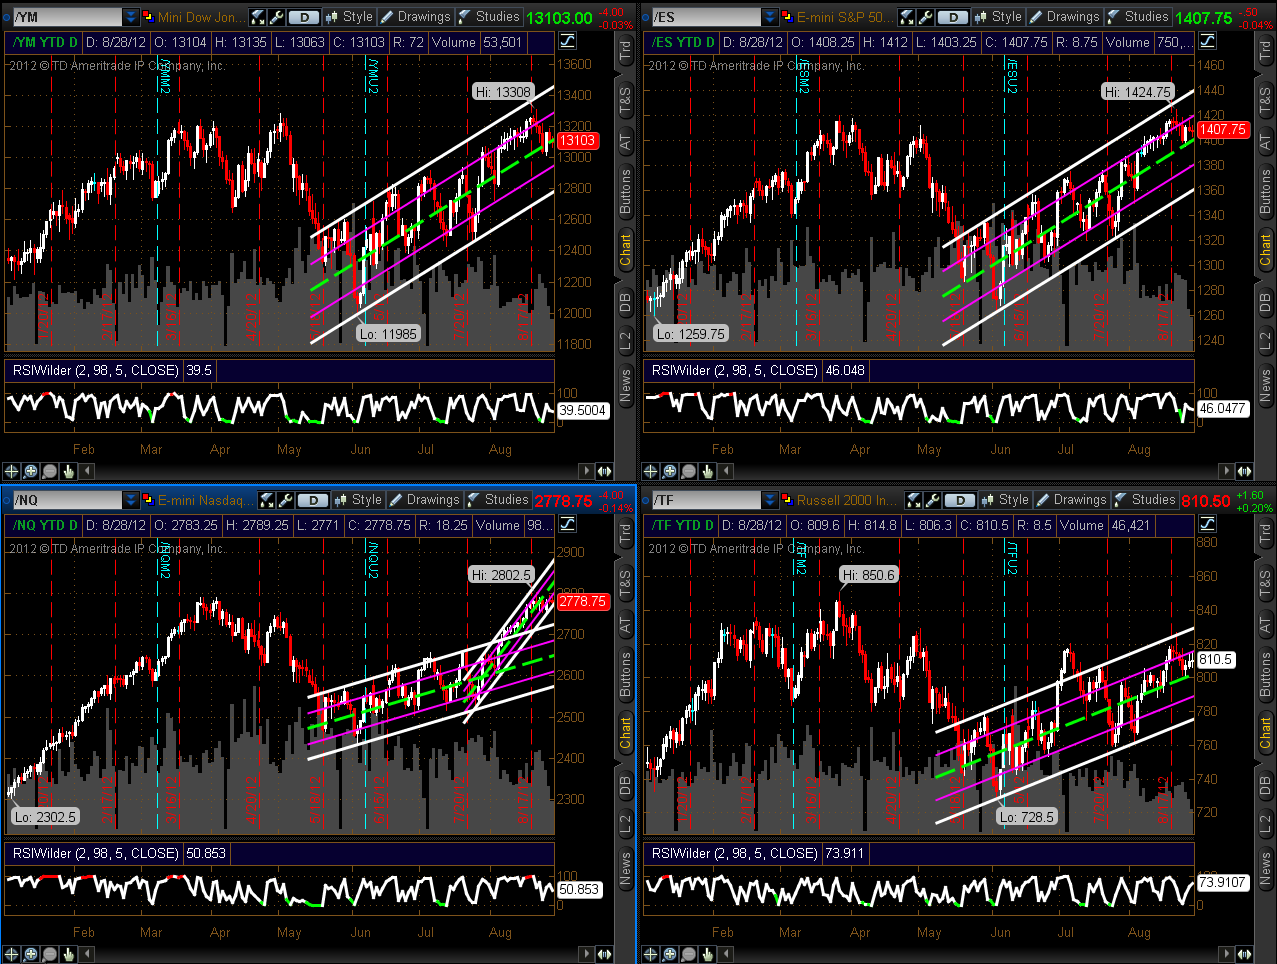

You can see how it
pulled further above the other Major Indices at the beginning of August on the
third Daily chart (which shows percentages gained year-to-date
for these indices) to form the steeper channel.

The fourth
1-day intraday chart shows a percentage
comparison chart of the Major Indices to the Emerging Markets ETF (EEM). You can
see that the Russell 2000 Index leads the Nasdaq 100, so far, today, while EEM
is the laggard (it's also the laggard for the year, which suggests that traders
are generally staying away from riskier foreign markets…a growth-averse vs
value-favoured environment).

Whether any
further profit-taking turns into a sell-off remains to be seen, but clues lie in
the channels. A break and hold below this steeper channel on the Nasdaq
100 Index, along with a break and hold below the "mean" of the channels
on the other three Major Indices, may signal the beginning of a sell-off in
equities…particularly if the Nasdaq 100 breaks and holds
below the upper edge of the larger channel below. Look for confirmation of such
a move using the methods outlined in my posts of August 27th and August 24th.
On the other hand, if leadership switches
to EEM on an intraday basis, that may be signalling the
beginning of a parabolic move upwards in the equity markets before we see a
sell-off/correction.
