
Further to my last weekly market update, this week's update can be summed
up in three words…more profit-taking.
The following
Weekly charts and graphs (for the past week) of the 6
Major Indices and 9 Major Sectors show that these
markets have not advanced for a second week as they struggle at major
resistance.


The following two
charts and graphs depict money flow for the month of August.
You can see that the majority of interest/buying occurred in the riskier
growth-oriented Technology and Small Cap Indices and Sectors versus a virtual
non-interest in the value-oriented defensive Indices and Sectors.


In
summary, whether we'll see a rotation of Sector preference in September
remains to be seen. I suspect that market action will, generally, be news-driven
as we await important decisions by the Fed, ECB, Germany's Constitutional Court
ruling on the legality of the ESM, Eurogroup meetings, further economic data,
the Dutch election, and any fall-out from the U.S. election campaigning, etc.
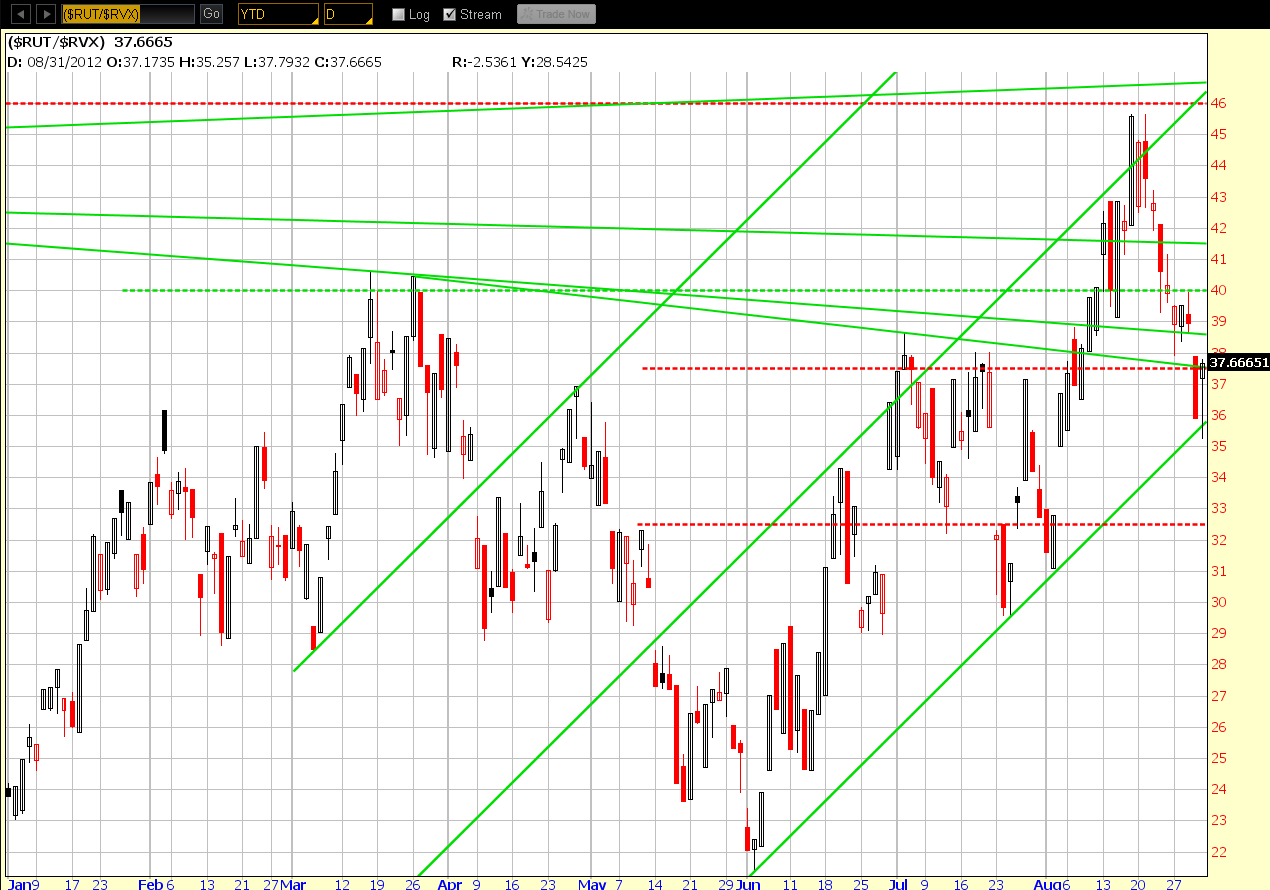
Since this tends to produce volatility, I'll continue to monitor it as
depicted by the following Daily ratio charts of the
SPX:VIX and RUT:RVX. As of Friday's close,
both the S&P 500 and Russell 2000 Indices are sitting near the apex of
trendline/channel resistance/support. Volatility has been rising the past two
weeks and a break of the apex one way or the other is inevitable soon. We may
see a build in volumes as price tries to establish a trend away from the
apex…something else I'll be monitoring in order to assess the
viability/sustainability of such a move. Perhaps we'll see a rotation into the
more defensive Sectors and Large Cap Indices in preparation for
volatility.

Enjoy the long
weekend and best of luck next week!
