
Further to my earlier post today (Thursday), here's where the markets closed after
the Fed announced a new round of monetary
stimulus.
Equities, as represented by the YM, ES, NQ &
TF, spiked and made the highest close, so far, this
week and this year, on higher volumes. The YM and ES are at/near the top of
their rising channel, while the NQ and TF are trading above, as shown on the
Daily charts.

The SPX and
RUT have room to go higher within their rising channels on their
respective volatility ratio charts, but have run into near-term
horizontal price resistance (triple tops).


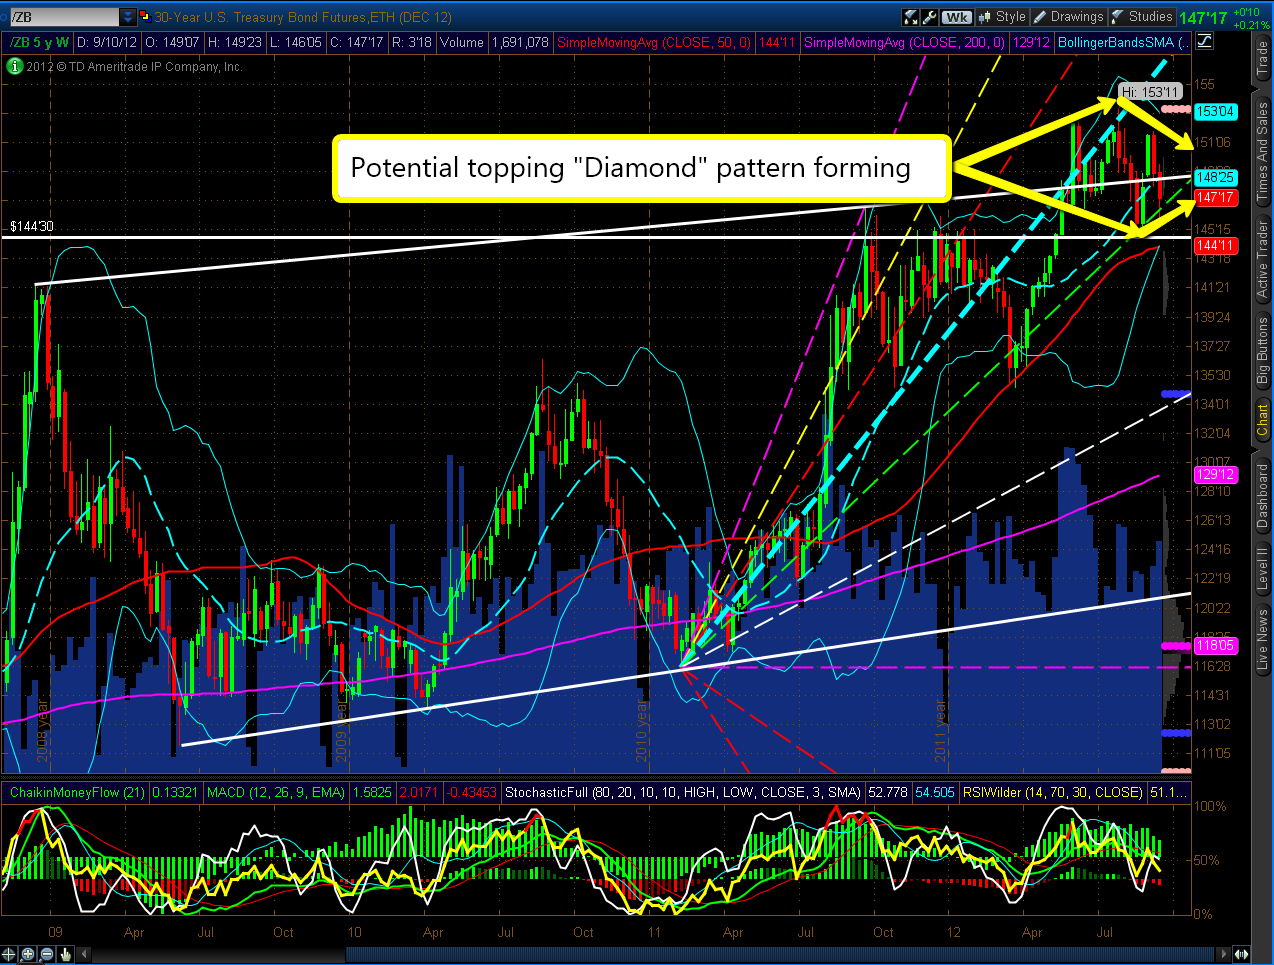
30-Year Bonds are still potentially forming
their "diamond" (potentially topping) pattern, as shown on
the Weekly chart below…one to watch to see which way the
eventual break of the diamond apex occurs and is held. Not shown on this chart
is the fact that daily volumes were higher today, while price spiked up and down
and closed almost unchanged from the open.
The U.S.
$ has reached its lower Bollinger Band on the Weekly
chart with near-term support below at 79.00, but major support is further below
at 78.00. Not shown on this chart is the fact that daily volumes were higher
today, while price closed near its low of the day.

These are some of the
charts I'll be watching over the next days/weeks ahead to gauge sentiment (and
the velocity of sentiment) in equities, bonds, and the $. For now, the momentum
is up in equities, unchanged on Bonds, and down on the $. The path of least
resistance for equities seems to be on the upside. I'll post a
more comprehensive market assessment this weekend.
