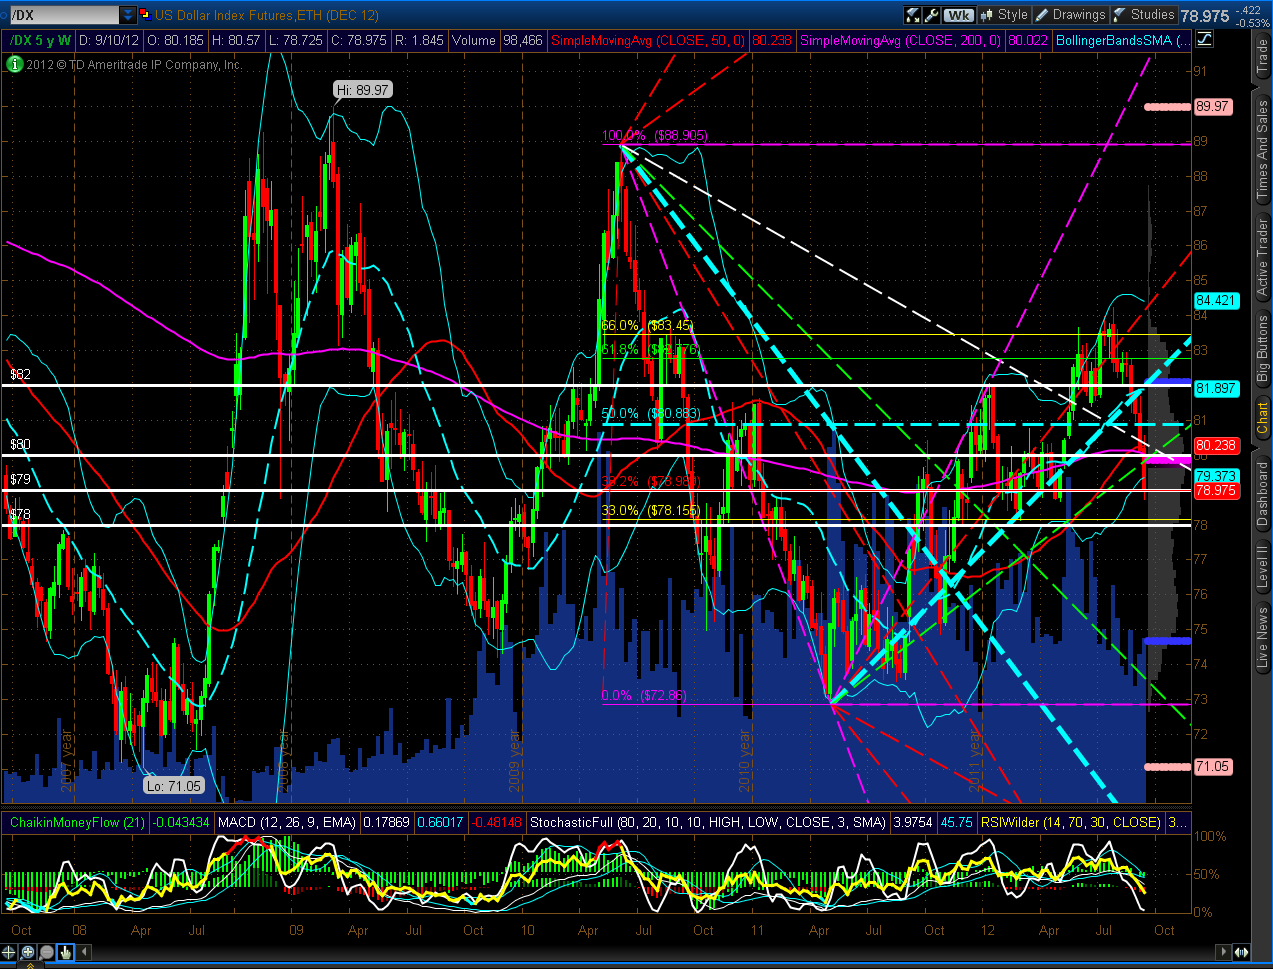
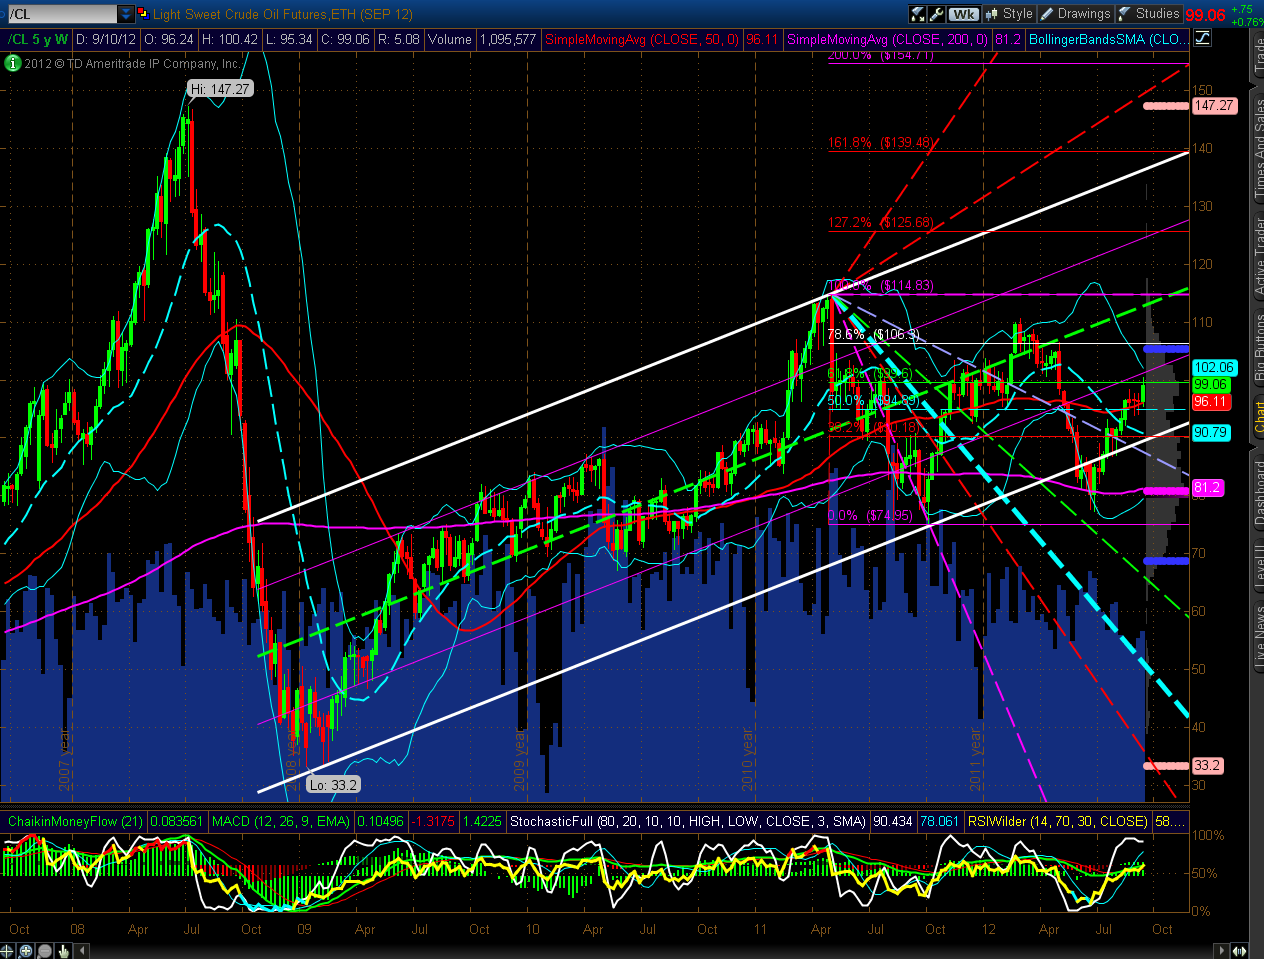
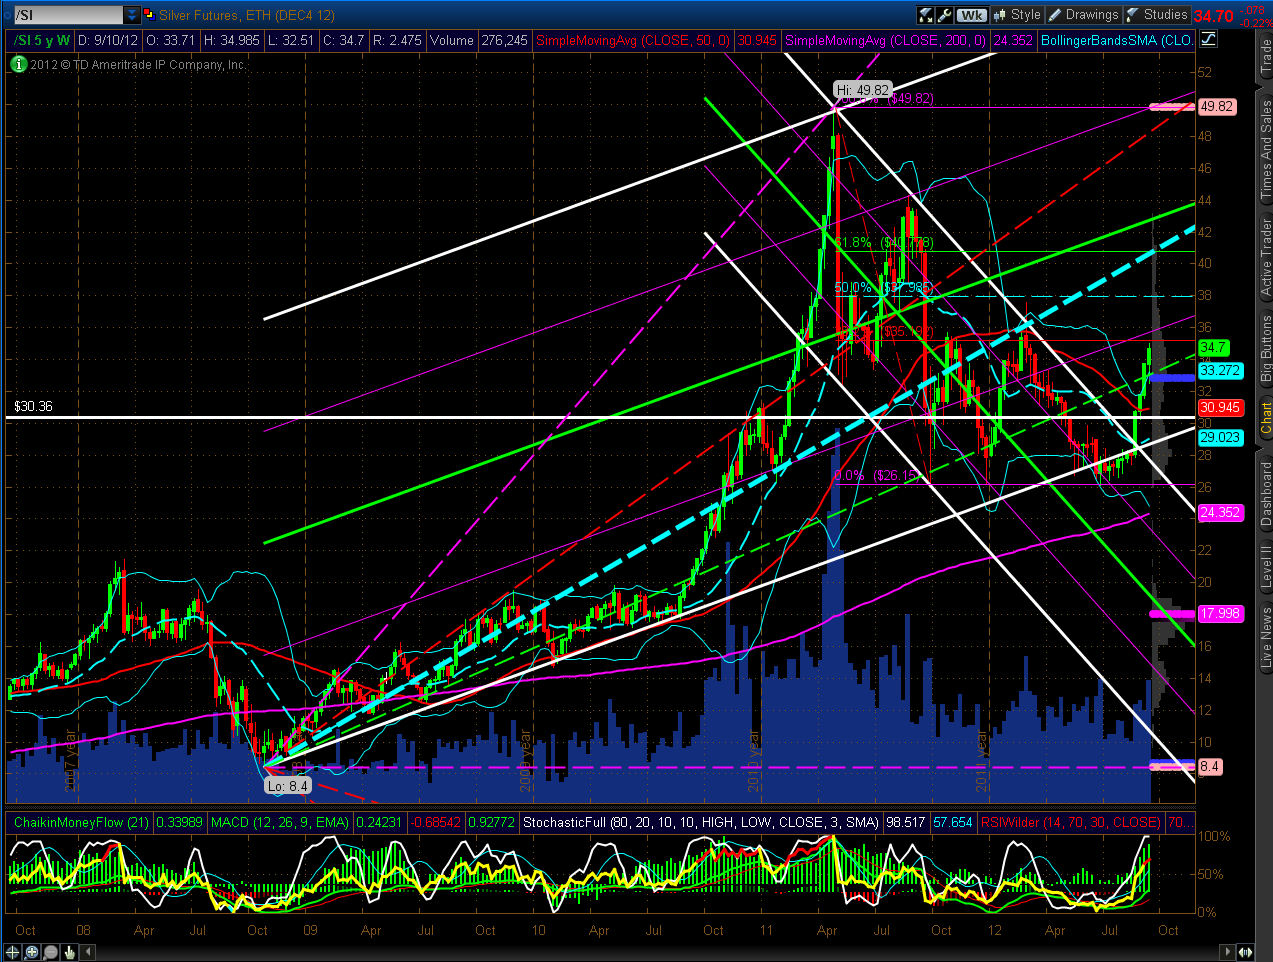
The following Weekly charts below depict support and resistance
levels for the U.S. $, 30-year Bonds, Gold, Oil, Copper, and
Silver.
The U.S. $ is at a minor support level (major support is
further below at 78.00), 30-year Bonds are at a major support level and have
broken below their "diamond" pattern that has been forming, Gold is approaching
major resistance, and Oil, Copper and Silver have reached fairly major
resistance. If we see a breach of major support and sell-off in the U.S.
$ and Bonds, then we should see Gold, Oil, Copper, and Silver blow through their
respective resistance levels…ones to watch to see if recent downside
and upside momentum continues, pauses, or reverses in the next few days
ahead.


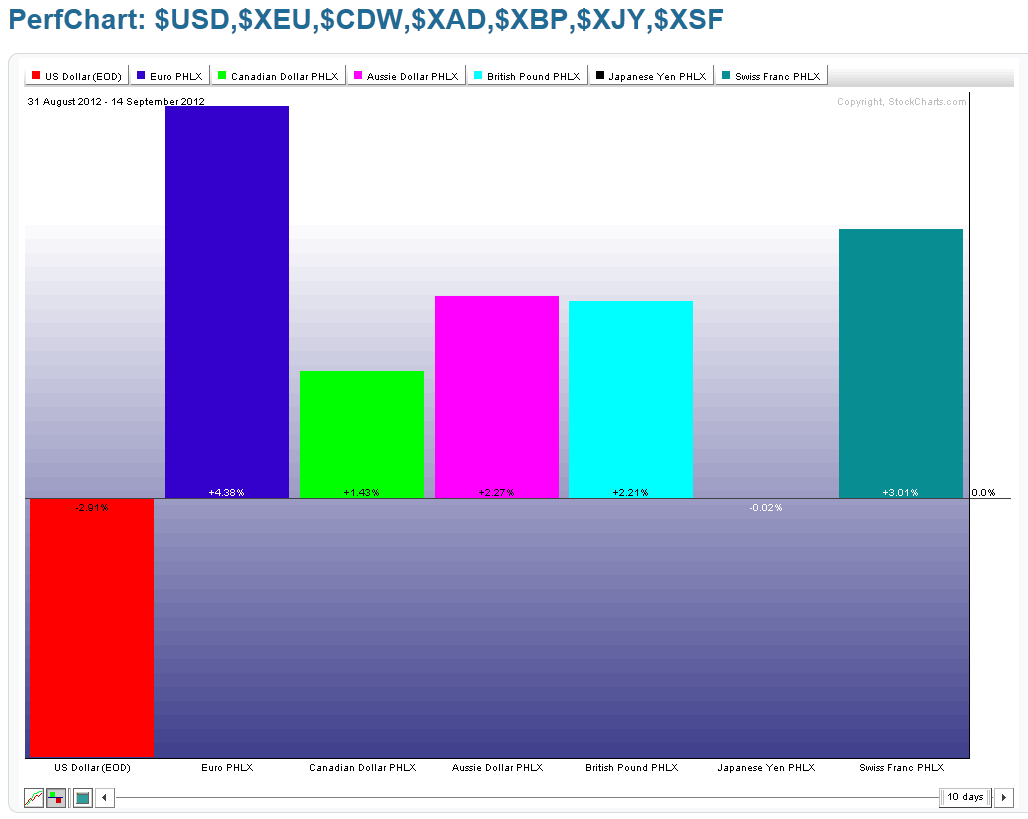
As shown on the
two currency graphs below, money continued to
flee the U.S. $ this past week (as it has for all of
September, so far), and continued to flow into the Euro, Aussie $, British
Pound, Swiss Franc, and Canadian $…ones to watch to see if this trend
continues over the next days/weeks.
A continued flow into the
Euro and the Aussie $ tells me that the European and Chinese financials/indices
should also continue to strengthen, as detailed in my last post.

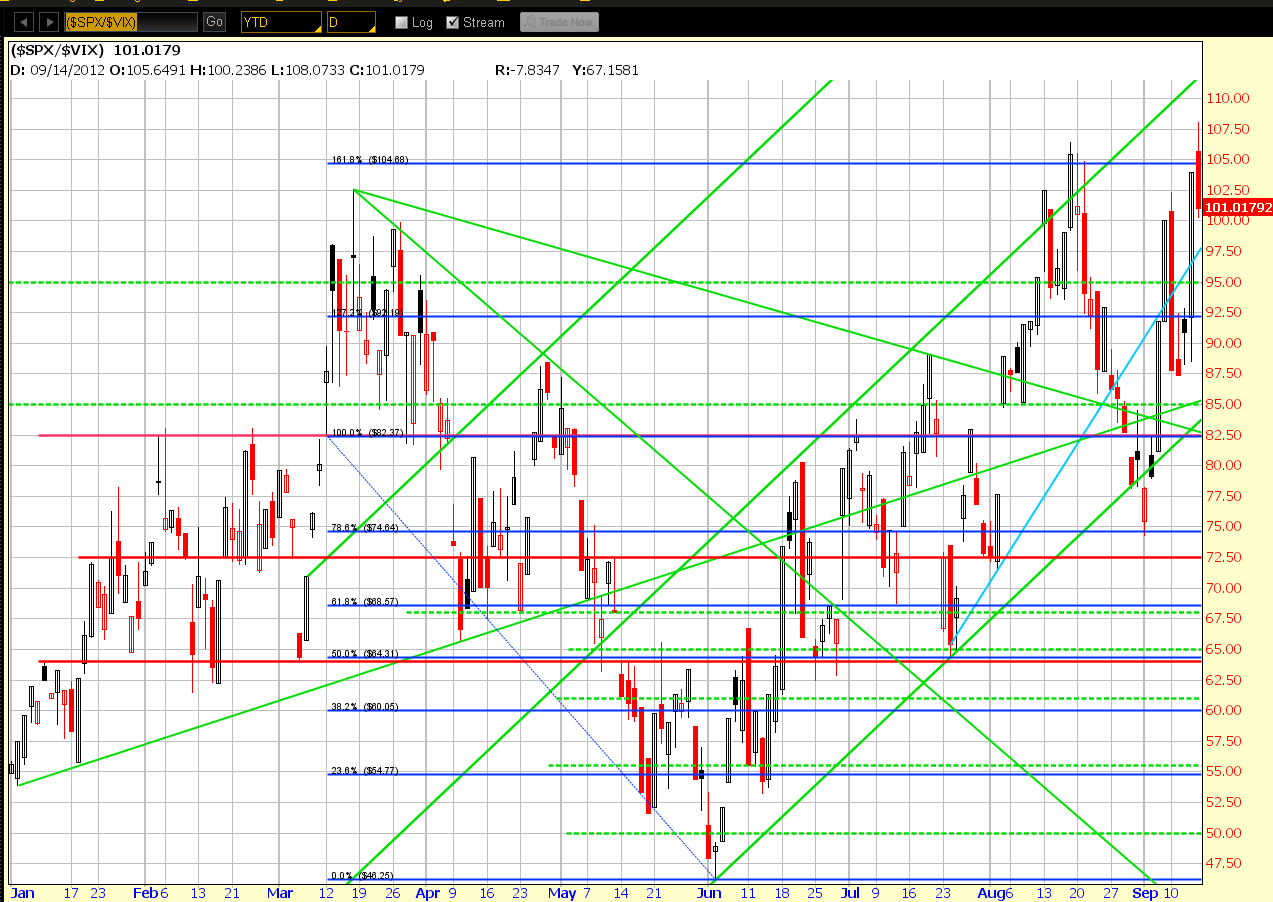
I had mentioned in my post of September 13th, that the SPX and
RUT have room to go higher within their rising channels on their
respective volatility ratio charts, as shown on the
Daily charts below, but had run into near-term horizontal price
resistance in the form of triple tops. On Friday, they both opened above this
resistance level, but the SPX lost momentum and fell back down below, while the
RUT managed to close above, albeit near its low of the
day.
Should the SPX and RUT regain upside momentum in the next
few days, we may then see a major breakdown in the U.S. $ and the 30-year Bonds,
and a further push higher in Gold, Oil, Copper and Silver.

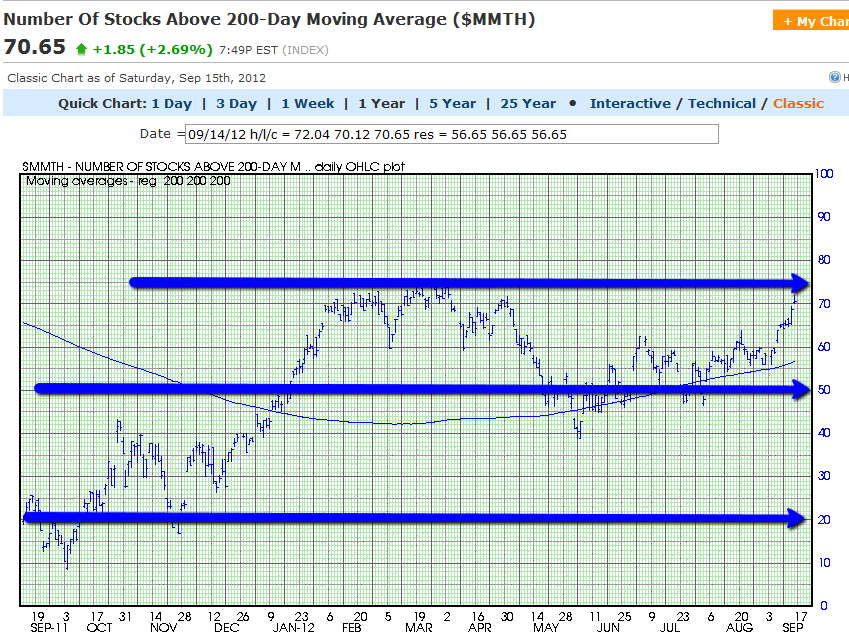
However, in
closing and as a caution, I'd note that the following three
Daily charts indicate that Stocks Above 20-50-200-Day
Averages are near major resistance levels.
While there
may be some further thrusts higher in equities, they may pull back soon
(possibly around the next Friday's OPEX, or the end of September/3rd Quarter)
before resuming any serious push higher…a scenario which should present itself
on the above volatility ratio charts.