
Further to my last weekly market update, this week's update will look at:
(a) Percentage Gains/Losses for the past week, as well as
(b)
Year-to-Date Leaders/Laggards of the various instruments within each group for
2012
for the following groups:
- + 6 Major Indices
- + 9 Major Sectors
- + Germany, France and the PIIGS Indices
- + Emerging Markets ETF (EEM) and the BRIC Indices
- + Canada, Japan, Britain, and World Market Indices
- + Commodity and Agriculture ETFs (DBC and DBA), Gold, Oil, Copper, and Silver
- + 7 Major Currencies
- + Ratio Charts of SPX:VIX and RUT:RVX
- + U.S. $
- + 30-Year Bonds
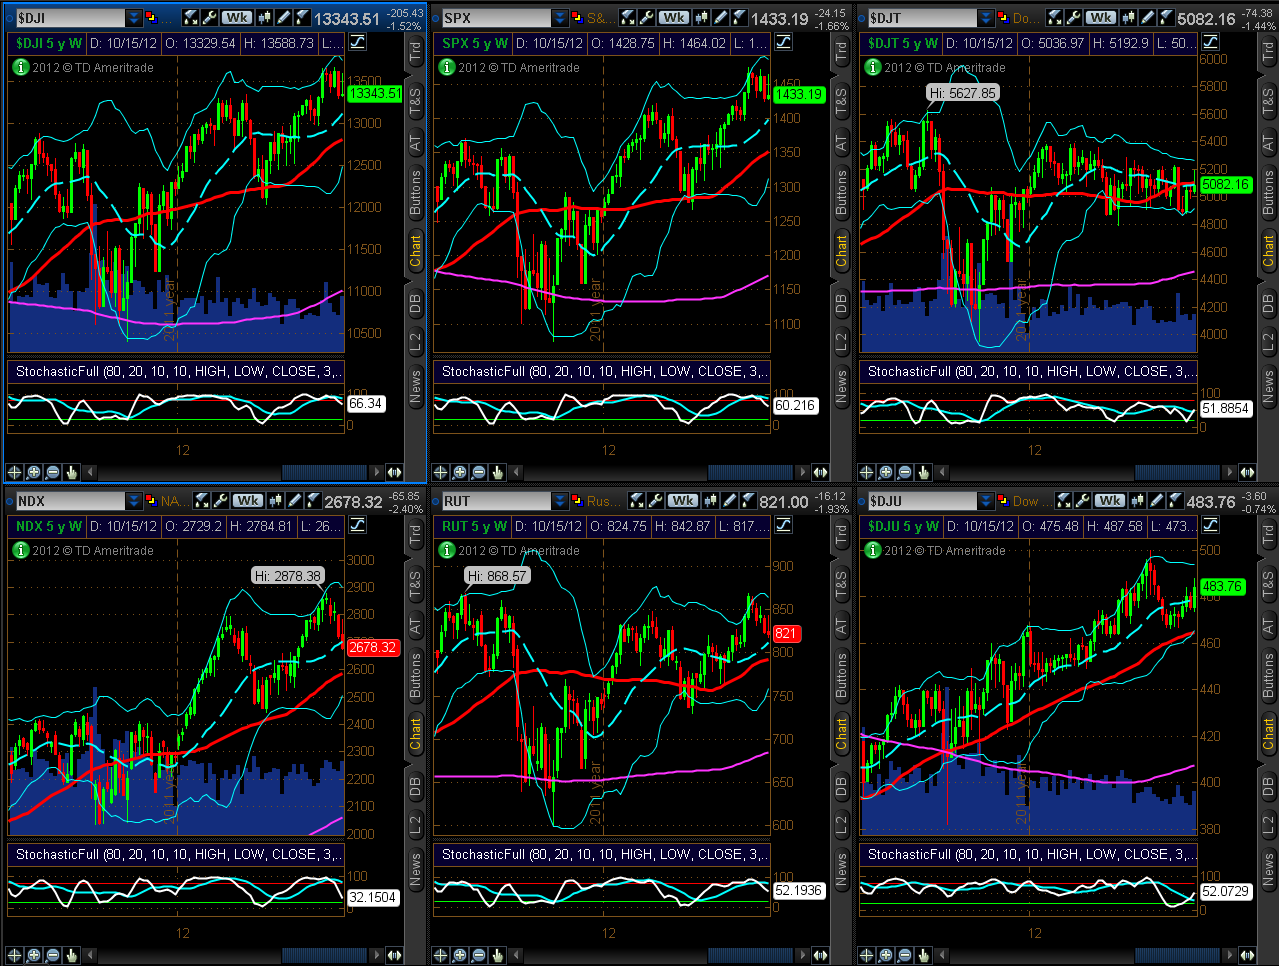
6 Major
Indices
All six Major Indices bounced at the beginning of the
week, only to decline into Friday's close, as shown on the Weekly charts below.
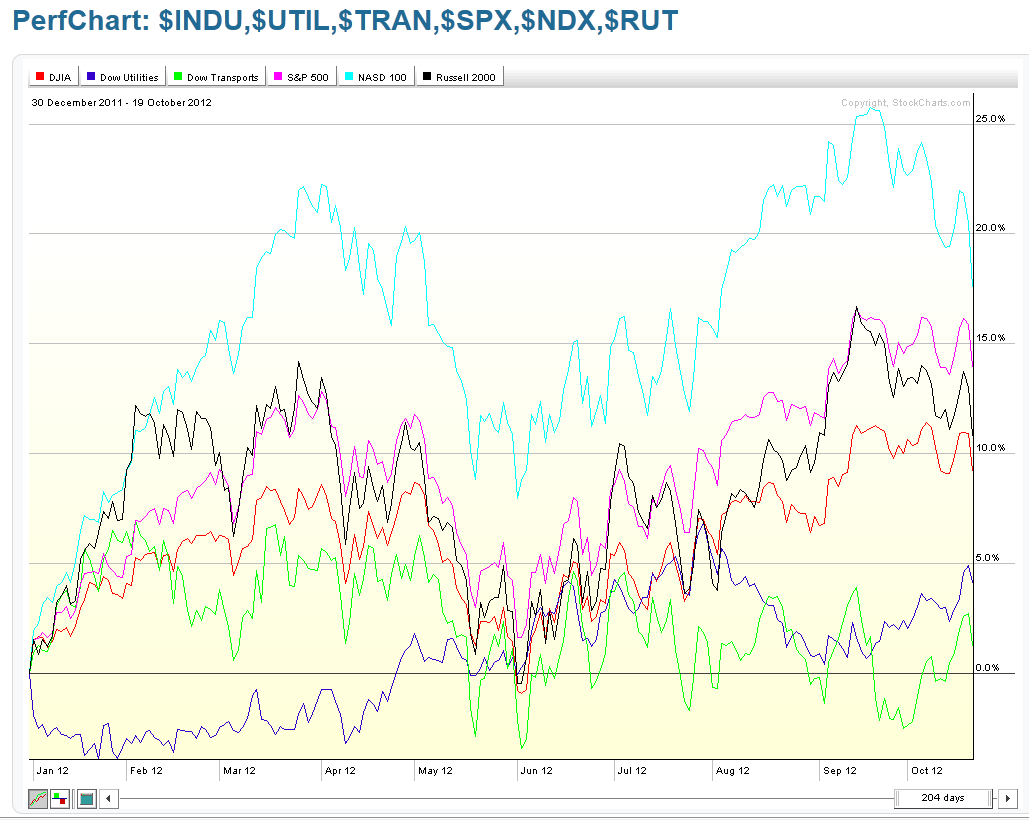
The 1-Week percentage
gained/lost graph below shows that the Dow Utilities gave up the least of its
weekly gains, while the Nasdaq 100 lost the most.

The Year-to-Date
percentage gained/lost graph below shows that the Nasdaq 100 is the leader,
while the Dow Transports is the laggard (and only just in positive territory),
so far, for 2012.

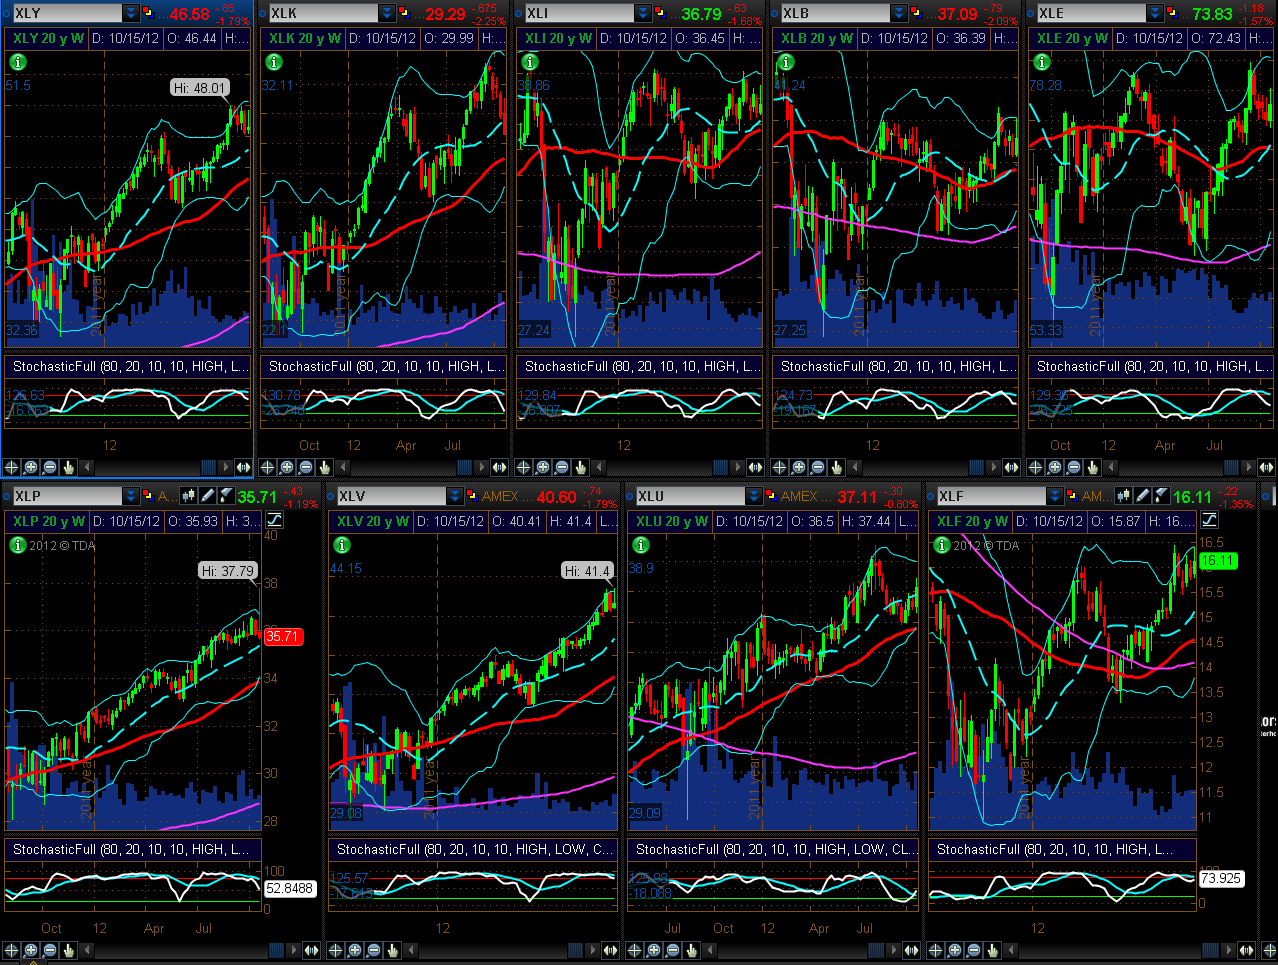
9 Major
Sectors
Similarly, all 9 Major Sectors bounced at the beginning
of the week, only to decline into Friday's close, as shown on the Weekly charts
below.
The 1-Week percentage
gained/lost graph below shows that the Materials Sector gave up the least of its
weekly gains, while the Technology Sector lost the most.

The Year-to-Date
percentage gained/lost graph below shows that the Financials Sector is the
leader, while the Utilities Sector is the laggard, so far, for 2012.
Germany, France
and the PIIGS Indices
The 1-Week percentage gained/lost graph
below shows that the Greek Index gained the most on the week, while Ireland
gained the least.

The Year-to-Date
percentage gained/lost graph below shows that the Greek Index is the leader,
while the Spanish Index is the laggard (and in negative territory), so far, for
2012.

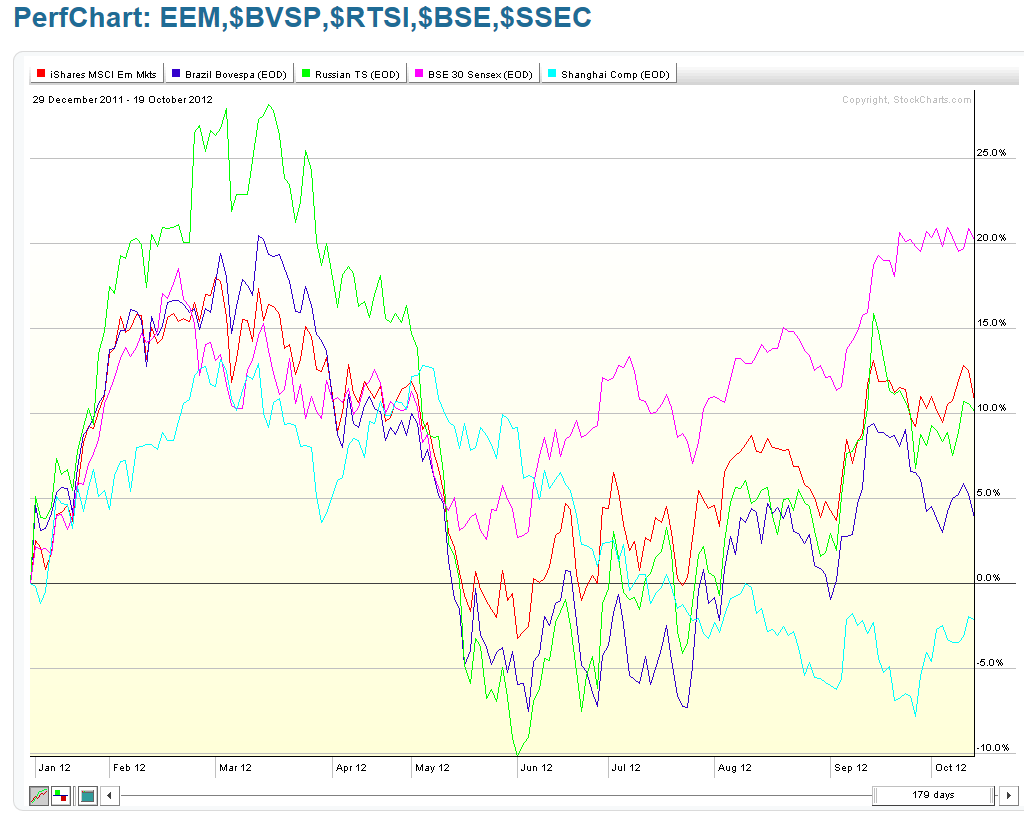
Emerging
Markets ETF (EEM) and the BRIC Indices
The 1-Week percentage
gained/lost graph below shows that China's Shanghai Index gained the most on the
week, while India lost the most.

The Year-to-Date
percentage gained/lost graph below shows that the Indian Index is the leader,
while the Shanghai Index is the laggard (and in negative territory), so far, for
2012.
Canada, Japan,
Britain, and World Market Indices
The 1-Week percentage
gained/lost graph below shows that Japan's Index gained the most on the week,
while Canada's Index gained the least.

The Year-to-Date
percentage gained/lost graph below shows that the World Index is the leader,
while Canada's Index is the laggard, so far, for 2012.

Commodity and
Agriculture ETFs (DBC and DBA), Gold, Oil, Copper, and
Silver
The 1-Week percentage gained/lost graph below shows
that of the two ETFs, DBC lost, while DBA gained on the week. Of the actual
Commodity Futures, Silver lost the most, while Oil lost the least.

The Year-to-Date
percentage gained/lost graph below shows that Silver is the leader, while Oil is
the laggard (and in negative territory), so far, for 2012. DBC is slightly ahead
of DBA in terms of percentage gained for the year (DBA is just above
flat).

7 Major
Currencies
The 1-Week percentage gained/lost graph below shows
that the Aussie $ gained the most on the week, while the Canadian $ lost the
most. The U.S. $ was flat.
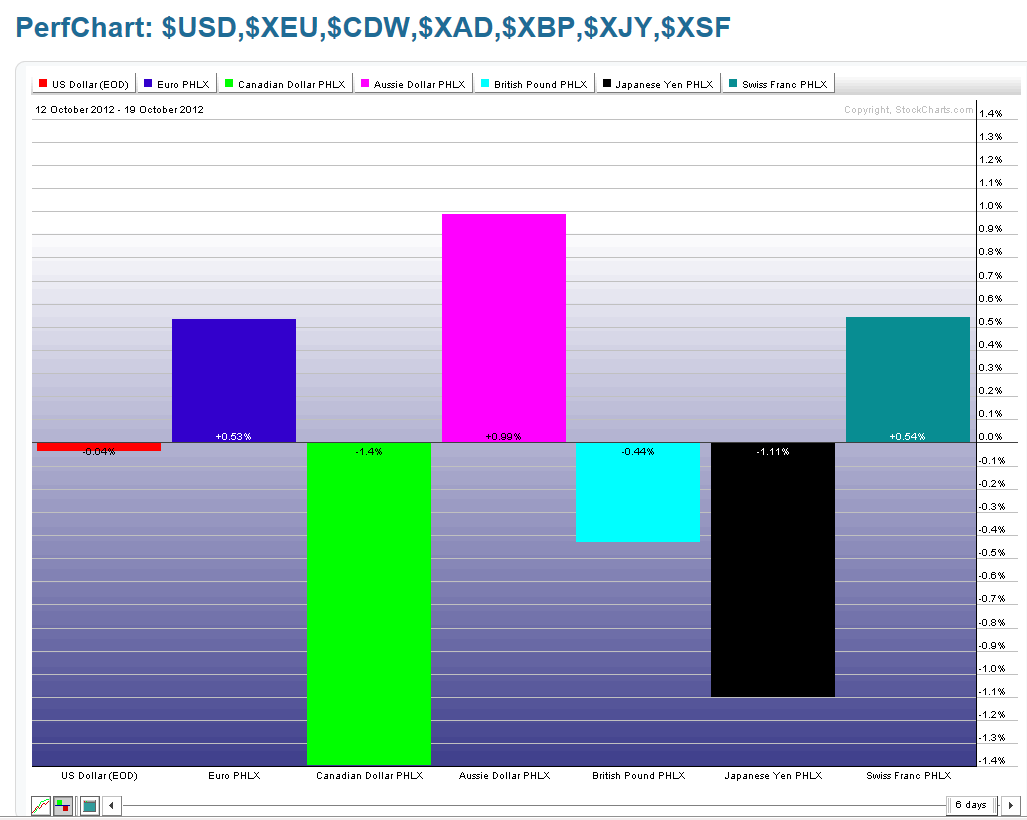
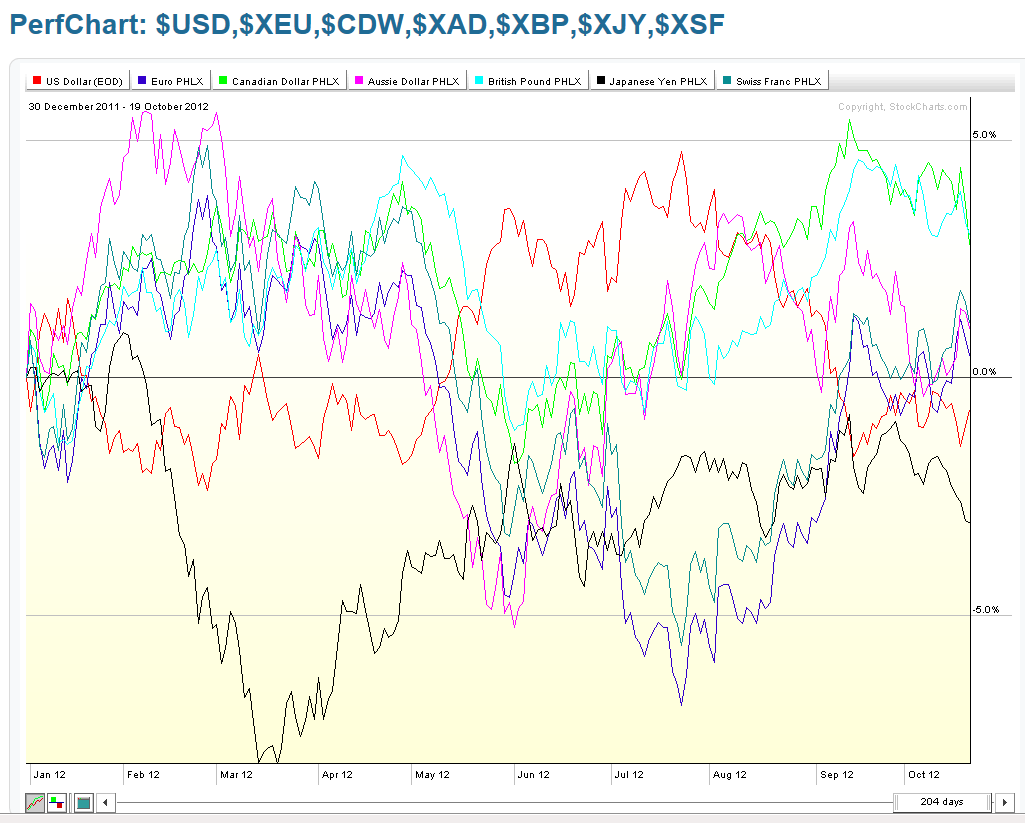
The Year-to-Date
percentage gained/lost graph below shows that the British Pound is the leader,
while the Japanese Yen is the laggard (and in negative territory), so far, for
2012. The U.S. $ and the Euro are, essentially flat.
Ratio Chart of
SPX:VIX
This Year-to-Date Daily ratio chart of the SPX vs. the
VIX shows that price has, once again, closed below the bottom of the rising
channel and trendline, and has made a lower swing low. The Momentum indicator
has also crossed below the zero level. Further price action below Friday's close
will signal a further rise in volatility, along with more selling in the S&P
500 Index.

Ratio Chart of
RUT:RVX
This Year-to-Date Daily ratio chart of the RUT vs. the
RVX shows that price has, also, closed below the bottom of the rising channel,
and has made a lower swing low. The Momentum indicator also crossed below the
zero level. Further price action below Friday's close will signal a further rise
in volatility, along with more selling in the Russell 2000 Index.

U.S.
$
Price closed on this Weekly chart of the U.S. $ just below an
important major resistance level of 80.00 and is holding above an important
support level of 79.00. A recapture and hold above 80.00 will likely add to
the selling pressure on equities.

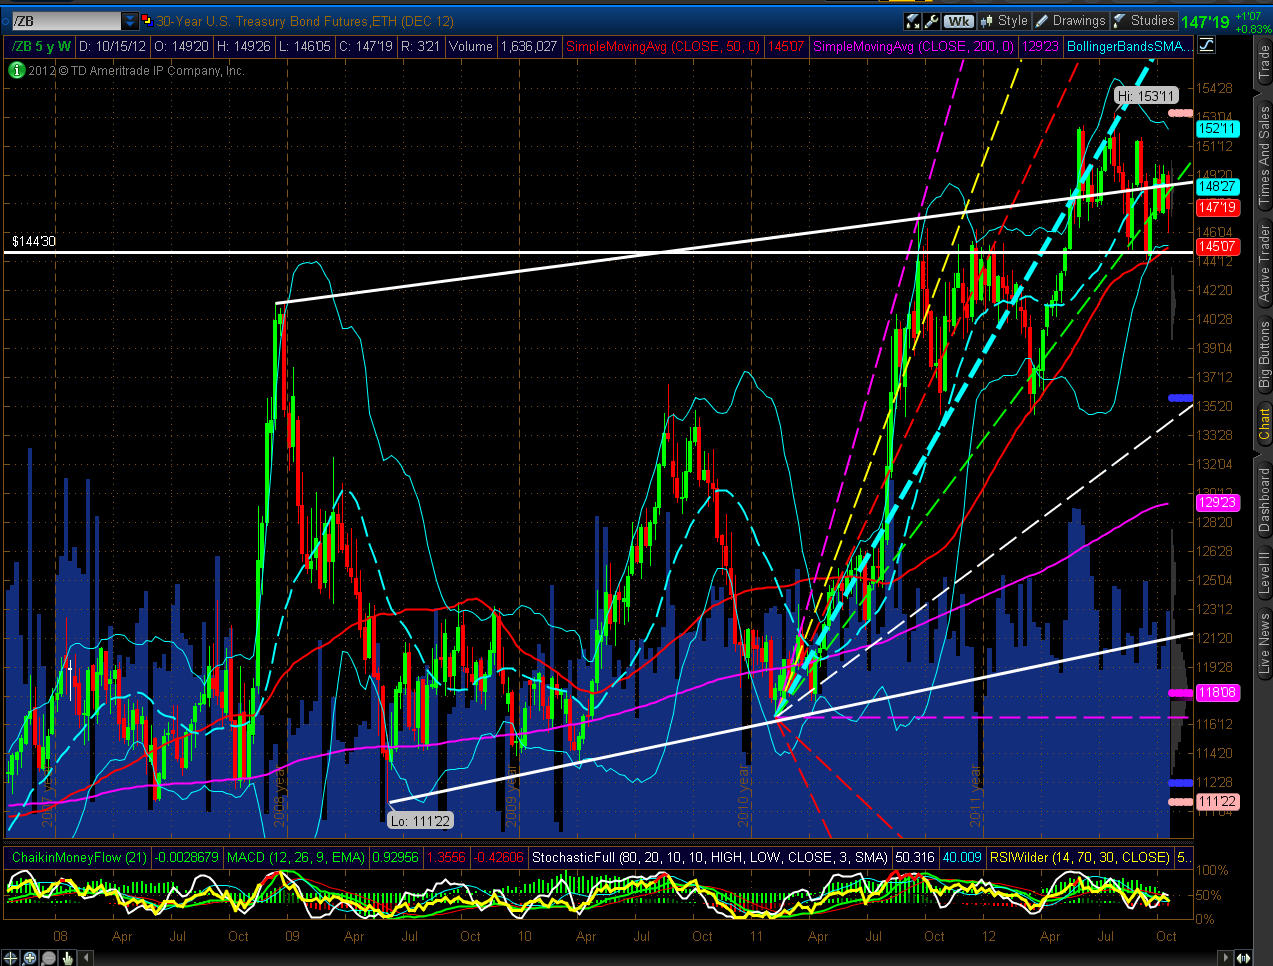
30-Year
Bonds
Price is holding above a confluence of price/Bollinger
Band/50sma support at the 144'30 level. Further buying above Friday's close will
likely add to the selling pressure on equities.
In
summary, for the coming week, I'd repeat what I said in my last weekly
summary…namely, if we see a major breakdown in Commodities and a rally in the
U.S. $ and 30-Year Bonds, we may see a further pullback in equities, and there
will be a rise in Volatility. This past week, we've seen:
- + selling in Gold, Oil, Copper and Silver
- + the U.S. $ regain most of its weekly losses
- + an end-of-week bounce in 30-Year bonds
- + a failure of U.S. Major Indices and Sectors to hold onto most of their
mid-week gains - + a 2.11% decline in the Technology Sector, along with a 1.54% decline in the
Nasdaq 100 Index - + within the Major Indices group, the Nasdaq 100 Index is the Leader for 2012
and is the one to watch for signs of further weakness, as mentioned in my post of October 16th, which warns of a potential Technology
bubble
In other groups:
- + the Greek Index has gained the most (in terms of percentage) during 2012 and
the past week (one to watch for signs of weakness) - + The Shanghai Index has gained the most during the past week, but is still in
negative territory for 2012…the one to watch for any signs of stabilization,
as it has not yet bottomed, as mentioned in my post of October 18th - + EEM was unable to hold onto its initial gains and closed almost flat for the
week…one to watch for further signs of weakness, as mentioned in my post of October 17th, concerning the formations of a large
Weekly and smaller Daily Head & Shoulders patterns - + Britain's FTSE 100 Index is facing major technical and
fundamental resistance at the top of its very large and, potential, topping
pattern, as mentioned in my post of October 18th…one to watch for signs of further
weakness after some profit-taking began on Friday
Also, since the
FOMC meeting is this coming Wednesday, and we're now in Q3 Earnings Season (some
of which have already been well below analyst expectations), we may see more
volatile intraday swings between now and then, particularly as tension builds
heading into the U.S. Presidential election on November 6th (the last
Presidential debate is this coming Monday), along with concerns about the
impending U.S. Fiscal Cliff scenario, public and political/economic/fiscal
unrest in some European countries, and rising tensions in the Middle East and
between China and Japan.
Fund managers may seek safety in the U.S. $ and
30-Year Bonds, while reducing their holdings in the Year-to-Date "group leaders"
as a defensive measure against further weakness/selling in those groups. In this
regard, at risk are:
- + Nasdaq 100 Index
- + Financials Sector
- + Greek Index
- + Indian Index
- + World Index
- + DBC (Commodities ETF)
- + Silver
- + British Pound
Enjoy your weekend and good luck next week!
