
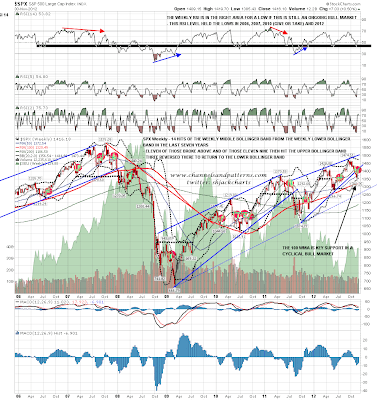
I was saying in my weekend post at Marketshadows yesterday that if we are going to see the bullish scenario into 2013 fail, then the most likely place to see that failure is near the highs last week, as SPX tries to break over the weekly middle bollinger band. You can see that post here. Historically the odds for a break above are good, with fourteen moves to test the weekly middle BB from the lower BB in the last seven years, of which eleven broke back above, and of those nine then reached the weekly upper BB, now in the 1455 SPX area. However three of those did reverse at the middle bollinger band:
We are also at an obvious possible point of failure on the daily SPX chart, with the 50 DMA, now at 1421.60 being tested at the highs last week. Short term support is at the 100 DMA at 1409, and the recovered rising wedge lower trendline which is in the same area:

Why am I considering failure here with the falling wedge and IHS targets on SPX in the 1433/4 area? SPX has been testing the underside of the strong resistance zone 1420-30 and is showing quite a bit of negative RSI divergence there on the 60min chart. There's still a very decent chance of making those SPX pattern targets, but this has a potentially bearish look:

There is now a lot of support not far below on the SPX chart. The 100 DMA and recovered rising wedge support are in the 1409 area, and SPX rising channel support is in the 1404/5 area at the open today. As long as channel support in particular holds my lean is still bullish, but if that breaks then the uptrend will be in doubt and the way would be open to retest strong support in the 1390 area on SPX (and 1388 on ES). That would fit with a retest of the daily middle bollinger band on SPX, currently in the 1392.86 area:

There is also clear negative RSI divergence on the NDX (and AAPL) 60min chart, and while I'd be happier with a reversal from the 2700 area, we might see reversal here. If so I'd be looking for a retracement into the 2630-40 area to make the right shoulder on an IHS:
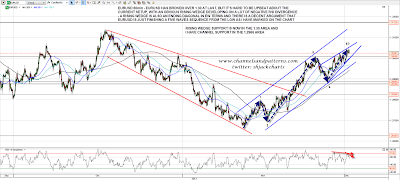
EURUSD has now broken above 1.30 area resistance, but the setup there looks doubtful as well. There is clear and increasing negative divergence on the 60min RSI, and the move from 1.2881 has been forming a rising wedge or an ending diagonal. I was considering possible EW counts on EURUSD this morning and there is definitely an argument that this is a fifth wave ending diagonal, suggesting that we may see a significant swing high made shortly. Again there is strong support not far below as I have rising wedge support in the 1.30 area and rising channel support in the 1.2966 area. On a break below channel support however I would be looking for a return to retest strong support in the 1.288 area, and that is now a possible H&S neckline of course:
On CL a strong support trendline has been established from the low last week, but it's very steep, and there is also clear negative 60min RSI divergence there. I have main resistance in the 89.7 area and I'd like to see that tested before any retracement and it's not far away now:

This bull move on equities looks a bit fragile here, and am wondering about at least a short term reversal either at the highs being tested last week, or not far above when the SPX pattern target area has been reached. There is strong resistance in that area with the SPX daily upper bollinger band in the 1435 area and strong resistance at the November highs in the 1432 ES area. That is a very obvious level to look for some retracement and if we see that tested this week we may well see a strong short term reversal there. That could develop into something more, but as I said last week, the bears are on the back foot as long as ES and SPX are above the very strong support levels in the 1388 ES and 1390 SPX areas.
