
I'll run SPX charts on various timeframes this morning. One that I won't show as I have a lot of charts today is the weekly chart, where I gave a target at the upper bollinger band a couple of weeks ago. SPX fell a few points short of that target last week, but it looks like a hit on the chart so I will count that target as made. Weekly middle bollinger band support is at 1425, but more often than not SPX continues to run up under the upper bollinger band after the first hit, so the odds do not favor an immediate return to the middle BB.
On the daily chart SPX has now closed over ten points below the upper bollinger band. I count twenty previous instances of this on my chart from July 2011, and sixteen of those subsequently made it back to the middle bollinger band before touching the upper bollinger band again, so the odds strongly favor that here. Daily middle bollinger band support is now in the 1435 area:

On the SPX 60min chart rising channel support is now in the 1410 area, and channel resistance is now in the 1473-5 area. The 60min RSI has hit 50 at the low yesterday and if we were to see a short term M top form here on negative RSI divergence and a test of the September high, I would expect the move up to do that here:

In terms of short term direction the setup on the SPX 15min chart looks clear. A declining channel has formed from the high and that may be a bull flag channel. If it breaks up today then we may well see a test of the current highs and there is room on the SPX 60min chart for a test of the September high as well. If we see more downside today then there is a possible small H&S that has formed targeting the 1434 support level on a break below 1450:

On the ES 60min chart immediate resistance is at the 50 and 100 hourly MAs. These have been holding on an hourly close basis overnight …. just, and as long as that continues the odds favor more downside. If we see an hourly close significantly above the 100 HMA that doesn't rule out more downside, but it does make the odds of seeing that significantly worse:

On other markets EURUSD is in a short term downtrend with no obvious sign of short term reversal. There is strong support around 1.30 and main uptrend support from the 2012 low is slightly lower in the 1.297 area:

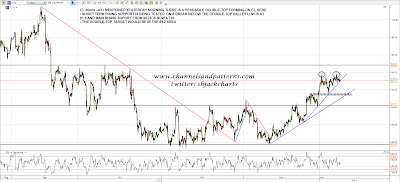
I mentioned the possible short term double-top forming on CL yesterday and that's still in play this morning. If we see CL break below short term rising support in the 93 area the support levels to watch are the double-top valley low in the 91.5 area and rising support from 85.75 in the 91 area. On a break below both the double-top target is in the 89.2 area. If short term rising support continues to hold then my main upside target is the big resistance level around 94.8:
I'll close with a couple of though-provoking charts today. I recommended a copper long at symmetrical triangle support in mid-November, just before the low on equities that followed. Copper (shown on the JJC ETN) has now hit symmetrical triangle resistance and is reversing there so far:

I've read a few comments about the bullish looking action on BKX this week and I'd be inclined to agree …….. if BKX can break decisively above the current high. Until then, for reasons obvious from the chart, this isn't an attractive long entry level for the Bank Index:

The most important chart for today is the SPX 15min chart. If the declining channel there breaks up then we may well see a test of the current highs and very possibly then a test of the 2012 high not far above. if we see that test of the 2012 highs there is strong trendline resistance there and I'd be leaning towards a stronger retracement from there. The ES 60min chart is also worth watching. An hourly close much above 1455 before the open would be discouraging for bears here, if we see that close after the open, even more so.
