
I've been reading a lot this week about the imminent demise of the US Dollar and how this will propel equities to infinity and beyond over the next few years. As to whether this is right who can say for sure? What can be seen so far this week however is that USD is not showing any immediate signs of weakness. Just the opposite actually.
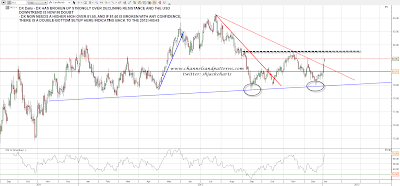
I mentioned the possibility that USD might break over declining resistance two days ago and that such a break would throw the overall downtrend into doubt. We have seen that break up, and the next target for USD bulls is a higher high over 81.50 on DX. If 81.50 was to break with any confidence then there is a double-bottom target at a test of the 2012 highs:
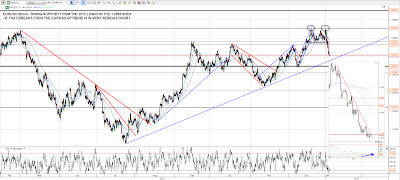
It's still a little early for dollar bulls to break out the champagne though, as there is a very important break that would first need to be made on EURUSD. EURUSD has tested the double-top target at the 1.30 area overnight (buffs fingernails modestly), but if we are to see the EURUSD uptrend break then we should see a break below rising support from the 2012 low on EURUSD, currently in the 1.2955 area. That isn't far below, but EURUSD looks like reversing here in the short term. I've inset on the chart below the short term setup, which was a marginal lower low at the 1.30 test on positive RSI divergence. As soon as EURUSD breaks over short term declining resistance I would expect a decent bounce to follow:
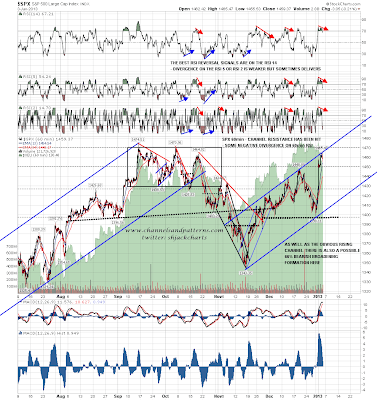
SPX closed just above the daily bollinger band yesterday. This can continue for a few days but there is good reason to think that we will see some retracement on SPX here. If we do see that retracement the obvious target is the middle bollinger band, currently at 1427 but rising three or four points per day at the moment:

I was looking at rising channel resistance on SPX yesterday morning and mentioned that if that trendline holds, then the 2012 high is unlikely to be tested for a few days. SPX reversed at that trendline at the high yesterday (continues to buff fingernails modestly) on significant 60min negative RSI divergence. This is the first decent chance for a retracement this week, and as long as that trendline holds today I'm expecting such a retracement:
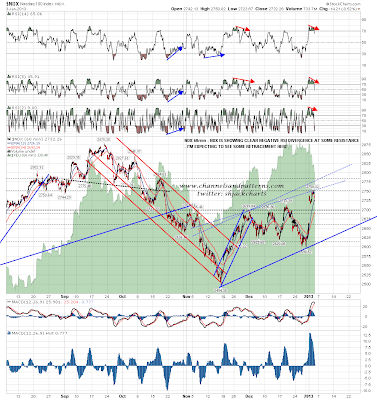
The trendline setup isn't as clear on NDX, but we are seeing some reversal at established resistance, again on significant negative RSI divergence. There will be an M top target in the 2590 area on a break much below 2620:
Is there a possibility that we are seeing a very significant high here? Possibly but I don't think so. The setup on the SPX weekly chart is arguing strongly for a test of the 2012 highs, and the smaller double-bottom setup on AAPL is arguing strongly for more upside here. You can see on the chart below that AAPL gapped up over the pattern trigger level on the smaller double-bottom, and patterns where this happens tend to make target. If the equity indices retrace here short term then we might see AAPL retest broken resistance in the 533-5 area, and that would be an attractive entry level for the 568 area double-bottom target which I would expect to be hit later:

I posted a Vix chart on twitter yesterday showing a test at the low yesterday of the rising support trendline from August. Again, that is arguing for a retracement on equities here:

I've been talking about the bullish overall setup on CL all week but have mainly looking at support levels. That's because CL has extended well above the rising support trendline which is now in the 90.2 area. I mentioned possible support in the 91.5 area yesterday morning and that was tested overnight. That may hold. As long as rising support holds my target is strong resistance in the 94.8 area:

For the start today ES is showing some strength having established strong support at 1450 yesterday. While I've been writing EURUSD has also broken declining resistance and should now be in a short term bottoming process. I'm leaning towards seeing a test of yesterday's highs on ES and SPX today, and as long as there isn't a strong break over those, I'd expect to see a decent retracement afterwards that would target the 1440 area on ES and might extend down as far as the globex close on Monday in the 1424 area. That is on the assumption that SPX rising channel resistance continues to hold. If it breaks then we may obviously see a test of the 2012 high as soon as today.
